


Researchers who form part of the Human Cell Atlas (HCA) initiative to map every cell type in the human body, in order to transform our understanding of health, infection and disease have published an interesting first for science, in Nature. Jardine, et al., have performed a comprehensive analysis of how the blood and immune systems develop in prenatal bone marrow. The group from the Wellcome Sanger Institute, Newcastle University and their collaborators, used single cell RNA technology to analyse bone marrow tissue samples, investigating and identifying cell types present and the genes expressed by the cells of interest. The study is imperative for our understanding of how the blood and immune systems develop in bone marrow, and how dysregulation may cause disease such as leukemia. In addition, these findings have important implications for diagnoses and treatments of disease.
Previously, it has been described how the human blood and immune systems begin to develop in the yolk sac and liver, a process known as haematopoiesis (READ MORE: Haematopoiesis). Haematopoiesis in the bone marrow (BM) maintains blood and immune cell production throughout postnatal life. Haematopoiesis begins in human BM at 11–12 weeks after conception, however, how haematopoiesis continued in fetal bone marrow (FBM) which is imperative to the developing fetus and newborn, remained to be elucidated until now. At the time when haematopoiesis begins, the fetal liver has initiated an immune repertoire, with further differentiation promoted by the spleen and thymus (Bone-marrow and Thymus). Fetal haematopoiesis is essential for the generation and development of erythrocytes for oxygen transport, platelets for haemostasis, macrophages for tissue remodelling and an immune system that is poised to respond to insult without risking tissue damage. Dysregulation of haematopoiesis in utero can have far-reaching implications, including KMT2A fusions or Down-syndrome-associated mutations in GATA1 that lead to an increased risk of childhood leukaemia.
In this present study, Jardine, et al., made use of single-cell multi-omics to investigate the constituents of disomic and trisomy-21 human FBM as haematopoiesis emerges and develops during the early second trimester. They performed multi-omics profiling and assessment of mRNA and multiplex protein epitope expression of fetal liver and cord blood cells to compare tissue-specific differentiation landscapes. As expressed by the authors, they validated; “(1) newly emerging cell states in FBM by fluorescence-activated cell sorting (FACS)-based prospective isolation for single-cell RNA sequencing (scRNA-seq) and morphology assessment; (2) the regional distribution of subsets of FBM endothelial cells by multiplex immunofluorescence imaging; and (3) the differentiation potential of haematopoietic stem cells (HSCs) using single-cell clonogenic differentiation assays. Drawing on existing scRNA-seq data from yolk sac, fetal liver, cord blood and adult BM (ABM), we show in humans how a complex multilineage blood and immune system is assembled in FBM within a matter of weeks.”
The researchers were able to completely define the establishment of haematopoiesis in the FBM within the first few weeks (6-7 weeks) of the second trimester and identify the BM as a key site of neutrophil emergence, myeloid diversification and B lymphoid selection (Figure 1). In addition, they were able to identify and define a significant and unique molecular profile of FBM HSC/multipotent progenitors (MPPs).
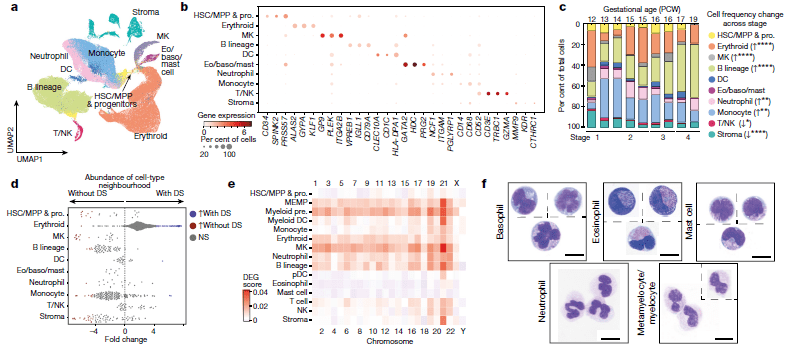
Figure 1: A single-cell atlas of human FBM. a, Uniform manifold approximation and projection (UMAP) of FBM scRNA-seq data (n = 9, k = 103,228, 12–19 PCW) by broad categories (Supplementary Table 7). Baso, basophil; eo, eosinophil; MK, megakaryocyte. b, Gene expression dot plot of cell-state-defining genes for broad categories in FBM scRNA-seq data. Dot colour indicates log-transformed, normalized and scaled gene expression value. Dot size indicates the percentage of cells in each category expressing a given gene. c, Frequency of broad cell categories in FBM scRNA-seq data. n = 9 biologically independent samples are grouped into four developmental stages to facilitate statistical comparison over gestational stage. P values from a quasibinomial regression model (subject to one-sided ANOVA; with correction for sort gates; computed at 95% confidence intervals and adjusted for multiple testing using Bonferroni correction) are shown in parentheses; *P < 0.05, **P < 0.01, ****P < 0.0001 (Supplementary Tables 18, 19). d, Beeswarm plot of the log-transformed fold change in abundance between cells in equivalent broad categories in FBM scRNA-seq datasets from fetuses with Down syndrome (DS) (n = 4, k = 16,743) and age-matched fetuses without Down syndrome (n = 2, k = 9,717) from biologically independent samples (Supplementary Tables 7, 20). Coloured dots indicate a significant difference in abundance (P value adjusted for multiple testing with a false discovery rate of greater than 10%) estimated with a two-sided quasi-likelihood test (null hypothesis: no difference in abundance between the two conditions). NS, not significant. e, Heat map visualizing the number of differentially expressed genes (DEGs) between equivalent cell states in FBM scRNA-seq datasets from fetuses with Down syndrome (DS) versus fetuses without Down syndrome. Data are scRNA-seq per chromosome, including correction for number of genes per chromosome (two-sided Wilcoxon rank-sum statistical test with Benjamini–Hochberg procedure for multiple testing correction; Supplementary Table 21). f, Cytospin images of FBM eosinophils, basophils, mast cells and neutrophils (n = 2 biologically independent samples; both 17 PCW, performed as two independent experiments) sorted according to the gating strategy in Extended Data Fig. 1 and stained with Giemsa. Images were concatenated as shown by the dotted lines. Scale bars, 10 μm (Jardine, et al., 2021).
Interestingly, the researchers went on to investigate bone marrow of patients with Down syndrome, identifying notable differences in gene expression that may help to shed light on why individuals with Down syndrome are more prone to developing immune disorders and other diseases such as leukemia. They identified an intrinsic bias of BM stem and progenitor cells in Down syndrome that is underpinned by genome-wide transcriptional changes.
In their own words:
“A better understanding of human developmental haematopoiesis has the potential to inform regenerative and transplantation therapies; for
example, through co-opting developmental programs to accelerate the reconstitution of haematopoietic stem cell transplants, and manipulating the lineage bias of differentiating progenitors to address specific deficiencies or for cellular therapy. For such endeavours to be successful, an initial phase of discovery science is critical. It is in this context that our study provides a comprehensive analysis of human FBM haematopoiesis to address a major previous knowledge gap.”
Journal Article: Jardine, et al., 2021. Blood and immune development in human fetal bone marrow and Down syndrome. Nature.
Summary by Stefan Botha