


In a recent study, researchers have engineered a sophisticated 3D human cellular model designed to replicate the complex interactions between brain cells and immune cells with a specific focus on Alzheimer’s disease (AD) (Figure 1). This innovative model allowed the team to unveil a critical phenomenon: as Alzheimer’s pathology accumulates in the brain, a specific subset of immune cells known as CT8+ T cells surges into the brain, intensifying the destructive impact of neuroinflammation. Moreover, the research team successfully identified the molecular mechanisms driving T cell infiltration into the brain and demonstrated that inhibiting these mechanisms mitigates the detrimental effects of T cell invasion.
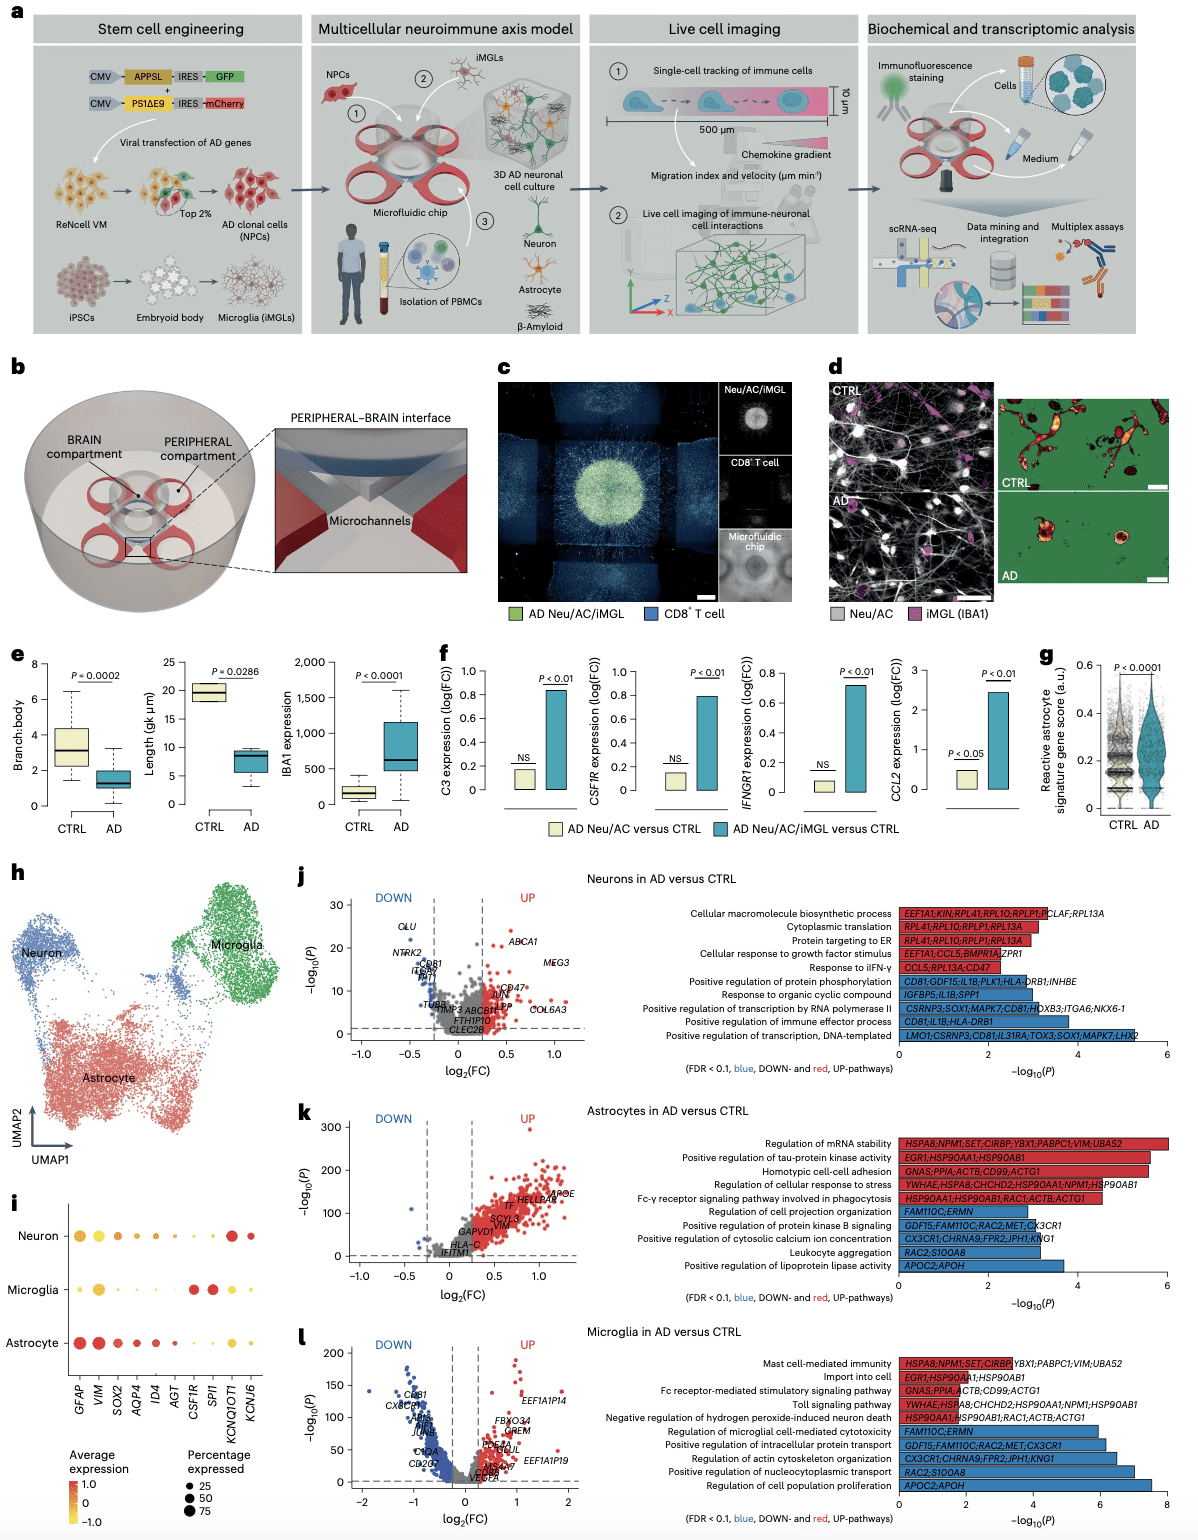
Figure 1: construction and characterization of a 3D human neuroimmune axis model of AD. a, Schematic representing a pipeline for modeling the AD brain in a 3D human neuroimmune axis model using stem cell-derived neurons, ACs and microglia, together with peripheral immune cells in a microfluidic system (referred to as the PiChip system). b, Schematic showing the PiChip system, which contains 400 narrow migration microchannels (4 sides, 100 on each side; 10 × 10 × 500 μm3 in height, width and length) connecting the BRAIN compartment to the four PERIPHERAL compartments. c, Confocal images of 3D-differentiated AD Neu/ACs and iMGLs (green) in the BRAIN compartment and nuclei-stained CD8+ cells (blue) in the PERIPHERAL compartments. Scale bar, 500 μm. d, Representative images of microglia morphology in CTRL and AD conditions stained for IBA1 (Neu/AC, gray; iMGL, magenta—left panel). Scale bar, 50 μm (left) and 10 μm (right). e, Microglia branch:body ratio, length and IBA1 expression in CTRL and AD conditions (n = 13 independent ROIs from 5 independent experiments for CTRL and AD branch:body ratio; n = 4 independent ROIs from 4 independent experiments for CTRL and AD microglia length; n = 12 CTRL and n = 18 AD independent ROIs from 5 independent experiments for IBA1 expression). The center lines show the medians, the box limits indicate the 25th and 75th percentiles and the whiskers extend to minimum and maximum values. P values are from a nonparametric, two-sided Mann– Whitney U-test. f, Whole RNA-seq analysis showing inflammatory and activated glial markers in AD cultures compared with CTRL. P values are from a quasi- likelihood edgeR:glmQLFTest method. NS, not significant. g, Highly enriched genes associated with reactive ACs in AD compared with CTRL. P values are from a nonparametric, two-sided Mann–Whitney U-test. h, UMAP visualization of the cell-type composition of the PiChip cultures by single-cell transcriptome profiles. i, Dot plot of identity genes for distinct cell types. Color scale indicates the average expression of identity genes in each cell population and dot size is proportional
to the percentage of cells expressing the identity genes. a.u., arbitrary units.
j–l, Volcano plots of differentially expressed genes (left) and GO of significantly upregulated and downregulated pathways (right) in neurons (j), ACs (k) and microglia (l) in AD compared with CTRL. ER, endoplasmic reticulum. P values are from Wilcoxon’s rank-sum test. Significantly upregulated (P < 0.05 and FC > 0.1) and downregulated (P < 0.05 and FC < 0.1) genes are shown as red and blue dots, respectively.
In AD, cognitive decline is intricately tied to the loss of neurons, often due to an inappropriate immune response and heightened inflammation in the brain triggered by the presence of amyloid beta deposits and tau tangles, two characteristic hallmarks of the disease. Notably, immune cells, especially T cells, originating outside the brain can infiltrate and exacerbate AD pathology.
This pioneering model, known as the 3D human neuroimmune axis model, encompasses stem-cell derived neurons, astrocytes, microglia, and peripheral immune cells. Powered by cutting-edge microfluidic technology, this model provides a unique vantage point to observe infiltrating peripheral immune cells within 3D cell cultures. It allows scientists to witness their interactions with brain cells and assess their influence on neuroinflammation and neurodegeneration.
Beyond merely observing heightened T cell levels in AD brain models, the research team pinpointed a crucial pathway involving a chemokine (CXCL10) and its corresponding receptor (CXCR3) that plays a pivotal role in governing T cell infiltration. By blocking this pathway, the researchers achieved substantial reductions in T cell infiltration and subsequent neurodegeneration in AD cultures.
These groundbreaking findings hold immense promise, potentially paving the way for novel therapies targeting immune cell infiltration in the brain of Alzheimer’s patients. Such therapies could represent a significant advancement in the fight against this devastating neurodegenerative disease.
Journal article: Mehdi., J., 2023. Infiltrating CD8+ T cells exacerbate Alzheimer’s disease pathology in a 3D human neuroimmune axis model. Nature Neuroscience.
Summary by Stefan Botha