


In a recent study, researchers have described new insights into “killer T cells,” also known as as CD8+ T cells (Figure 1). These cells are crucial in defending the body against viruses by eliminating infected cells. While much has been studied about these immune cells in adults, there has been a significant knowledge gap regarding how killer T cells evolve and function throughout a person’s life, especially in older adults.
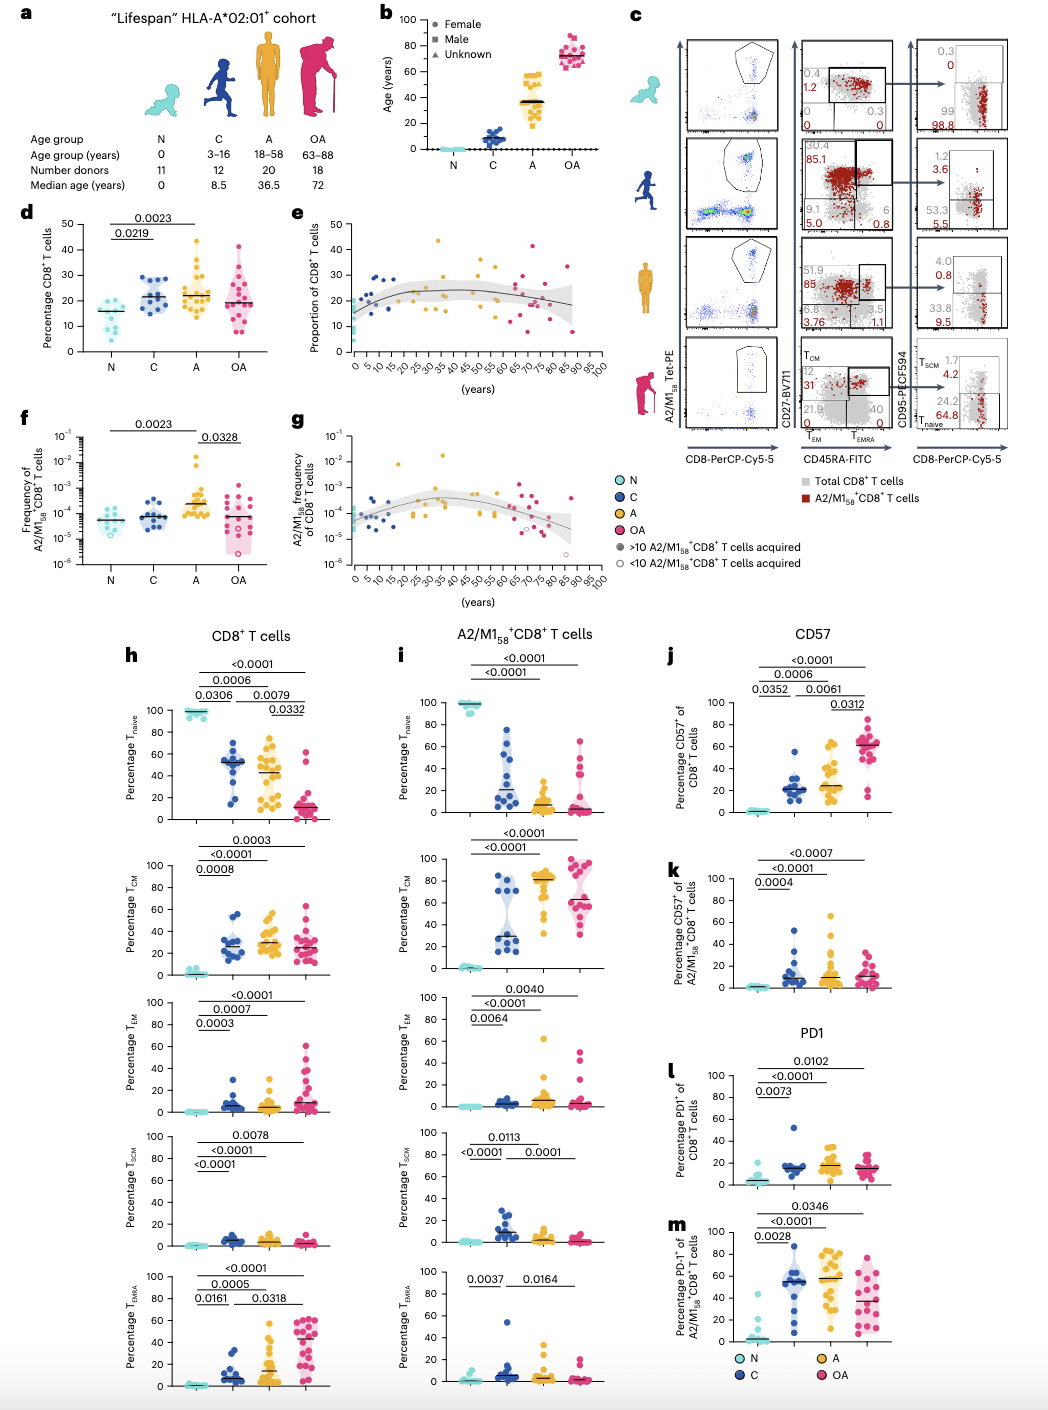
Figure 1: Age-related changes in A2/M158+CD8+ T cell frequencies and phenotypes. a, ‘Lifespan’ HLA-A*02:01-positive cohort, median age and number of donors per age category. b, Age distribution within the HLA-A*02:01-expressing lifespan cohort. c, Representative FACS panels and gating strategy for A2/M158+CD8+ T cells in the enriched fraction and phenotypic populations TCM (CD27+ CD45RA− ) cells, T EM (CD27− CD45RA− ), T EMRA (CD27-CD45RA+ ), Tnaive (CD27+ CD45RA+ CD95 − ) and T SCM (CD27+ CD45RA+ CD95 + ) cells. Gray dots represent total CD8 + T cells in the unenriched sample, red dots are A2/M158+CD8+ T cells in the enriched sample. d–g, Proportion of total CD8 + T cells (d,e) and frequency A2/M158+CD8+ T cells (f,g) across different age groups. Open symbols indicate <10 A2/M158+CD8+ T cells counted, which were not used for phenotypic analyses. h,i, Frequency of naive and memory subsets within the total CD8 + T cell (h) or A2/M158+CD8+ T cell populations (i) across all age groups. j–m, Frequencies of CD57 and PD-1 expression on CD8+ T cells (j and l, respectively) and A2/M158+CD8+ T cells (k and m, respectively) per age group. Horizontal bars indicate the median, dots represent individual donors, with n = 11 newborns, n = 12 children, n = 20 adults and n = 18 older adults (b–h,j,l) and n = 10 newborns, n = 12 children, n = 20 adults and n = 16 older adults (i,k,m). Black line is a locally estimated scatter-plot smoothing) Loess trend line with error bands shaded in gray representing 95% confidence interval (CI) (e,g). Technical replicates were not performed due to limited samples. Statistical analysis was performed using a two-sided Kruskal–Wallis with Dunn’s correction for multiple tests. P values are indicated above the graphs. N, newborn; C, children; A, adult; OA, older adult.
This study aimed to bridge this gap by examining killer T cells in individuals of different age groups: newborns, school-aged children, adults, and older adults aged 60 and above. Surprisingly, the research uncovered striking similarities in T cell responses between newborns, children, and older adults.
The highly efficient killer T cells typically found in children and adults seemed to wane with age, replaced by less effective cells in older adults. Remarkably, these less efficient cells, with diminished ability to recognize influenza viruses, exhibited genetic traits strikingly like T cells found in newborns.
The implications of this discovery are profound, as it offers the potential to revolutionise vaccinology. Understanding how immunity transforms throughout an individual’s life is invaluable. This study suggests that timing is a critical factor in bolstering killer T cells through vaccination, potentially ensuring these highly efficient immune warriors persist into old age.
Journal article: van de Sandt, C.E., et al., 2023. Newborn and child-like molecular signatures in older adults stem from TCR shifts across human lifespan. Nature Immunology.
Summary by Stefan Botha