


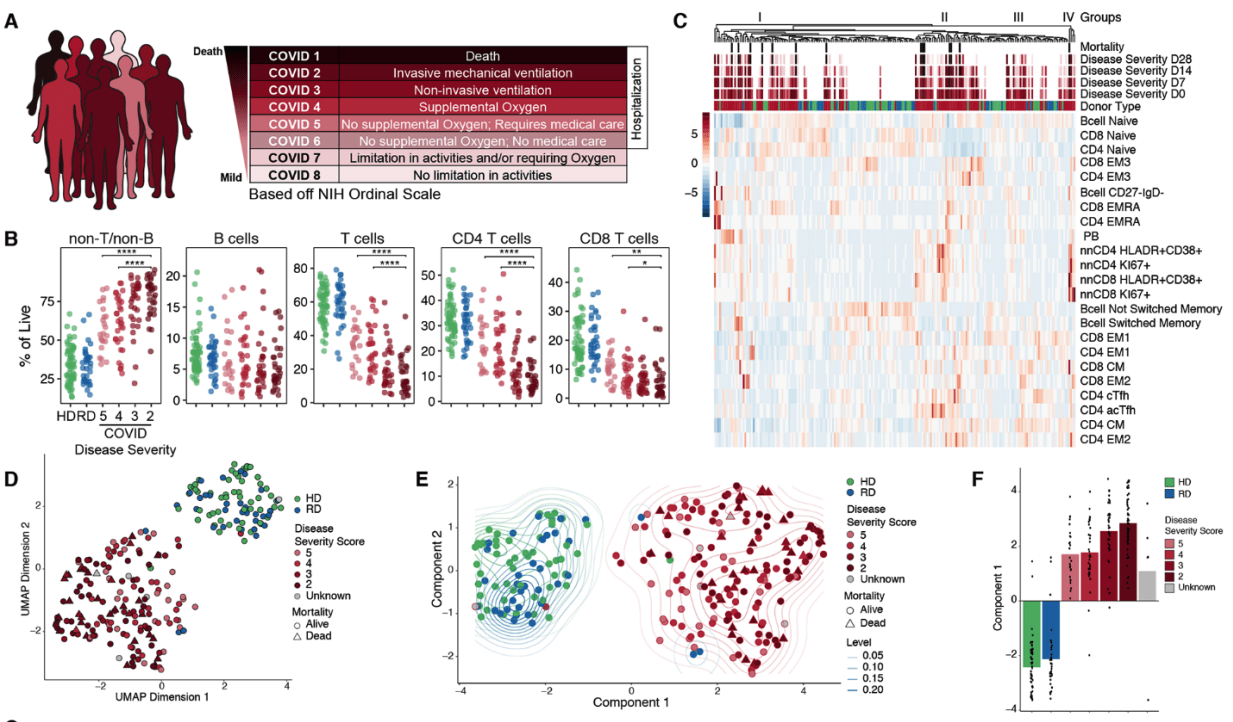
High dimensional analysis of immune phenotypes with clinical data reveals distinct COVID19 patient immunotypes. (A) NIH ordinal scale for COVID-19 clinical severity. (B) Frequencies of major immune subsets. Significance determined by unpaired Wilcoxon test with BH correction: *p < 0.05, **p < 0.01, ***p < 0.001, and ****p < 0.0001. (C) Heatmap of indicated immune parameters by row; donor type, disease severity, and mortality indicated across top. (D) UMAP projection of aggregated flow cytometry data. (E) Transformed UMAP projection; density contours drawn separately for healthy donor (HD), recovered donor (RD), and COVID-19 subjects (see Methods). (F) Bars represent mean of UMAP Component 1. Dots represent individual subjects; bars shaded by subject group and/or severity score. (Source: Mathew et al., 2020)
A recent article in Science used high dimensional cytometry to investigate the network of immune cell interactions and how they are connected in patients with COVID-19. Peripheral immune cells were analysed from 125 hospitalised patients with confirmed SARS-CoV-2 infection, 36 non-hospitalised patients who had recovered from infection and 60 healthy individuals. The authors found three “immunotypes”:
- Immunotype 1: activated CD4+ T cells with proliferative capacity, a relative lack of circulating T follicular helper cells along with highly activated or exhausted CD8 T cells. This category was correlated with more severe disease.
- Immunotype 2: a Tbetbright CD8 T cell responses, less robust CD4 T cell responses, and Ki67+ memory B cells.
- Immunotype 3: evidence of a failure of immune activation, with immune cells lacking any detectable response to infection and represented about 20% of COVID-19 patients and may represent those individuals who failed to make a robust T and B cell response to SARS-CoV-2.
By connecting and integrating the immunotypes with the trajectory of disease severity change over time, the authors created a topology of immune cell phenotypes with severity of disease and conclude: “This study provides a compendium of immune response data and also an integrated framework as a “map” for connecting immune features to disease.”
Journal Article: Mathew et al., 2020. Deep immune profiling of COVID-19 patients reveals distinct immunotypes with therapeutic implications. Science
Summary by Clive Gray