


When the body’s immune system is infected with the human immunodeficiency virus (HIV), it can cause autoimmune deficiency syndrome (AIDS) if left untreated. Dendritic cells, the immune cells that are in direct touch with the environment and patrol our bodies in search of pathogens and defending us from illnesses, are the entry point for HIV into the body. Dendritic cells operate as messengers and start the immune response by breaking down foreign proteins, chemicals, or particles and delivering them to immune system T-cells.
A collection of membrane proteins that discriminate between self and non-self is a crucial component that aids the dendritic cells in recognising and attaching to the virus. One such protein, Siglec-1, is essential for the early phases of HIV infection, especially for the virus’s capture and spread.
The major receptor on activated dendritic cells that binds to certain components of the HIV-1 particles has been identified in earlier investigations as Siglec-1; however, the precise methods by which this occurs are still unclear. For the purpose of creating efficient medications and treatments for those with HIV/AIDS, it is essential to comprehend the function of Siglec-1 in the immunological response to HIV.
A group of researchers recently published a paper outlining the processes underpinning the capture of HIV-1 viruses in dendritic cells as well as the function that Siglec-1 serves in the trafficking and capture of the viral particles (Figure 1).
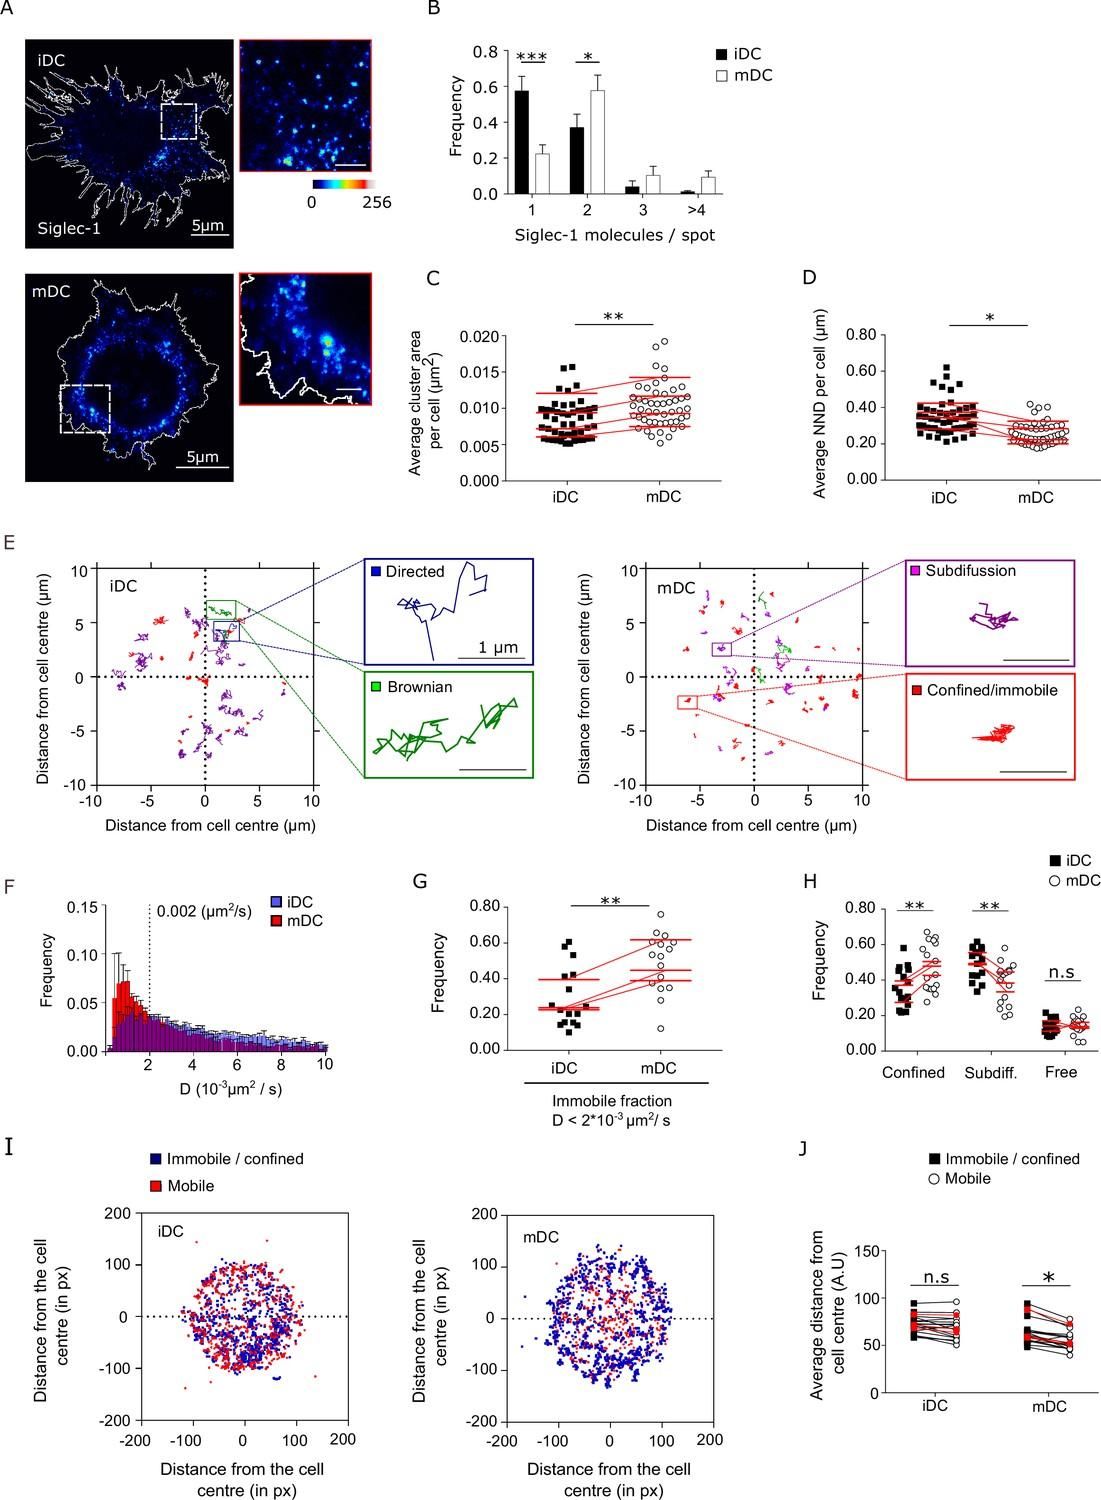
Figure 1: Dendritic cell (DC) activation induces the formation of Siglec-1 nanoclusters with decreased mobility. (A) Representative STED images of Siglec-1 in immature DCs (iDCs) and mature DCs (mDCs). The pseudo-color code denotes the intensity of individual Siglec-1-labeled spots, from monomer (dark blue) to nanocluster (red-to-white). The insets show enlarged regions highlighted by the white boxes on the main images (scale bar: 1 µm). Siglec-1 has been labeled using full Abs (see Materials and methods). Control experiments using single-chain Abs and different fixation methods are shown in Figure 1—figure supplement 1E–I, Figure 1—figure supplement 1—source data 1, and Figure 1—figure supplement 1—source data 2. (B) Frequency of the number of Siglec-1 molecules per spot, in iDC and mDC. Bars represent the mean ± standard error of the mean (SEM) of 3 different donors (minimum of 9 cells/donor and condition). (C) Average size of Siglec-1 spots and (D) proximity between individual spots, calculated by measuring the nearest neighbor distance (NND) between spots per cell, in iDC and mDC. Each symbol in (C, D) corresponds to an individual cell, red lines are the average value on iDCs and mDCs for each donor (4 donors, 9 cells/donor and cell type). (E) Representative Siglec-1 trajectories with the receptor labeled with single-chain Abs at sub-labeling conditions as recorded on an iDC (left) and an mDC (right). The magnified insets show examples of different types of motion as classified by the MSS analysis. (F) Frequency of the diffusion coefficients for individual Siglec-1 trajectories on iDCs and mDCs. The dash vertical line corresponds to the diffusion threshold to separate immobile from mobile particles (0.002 µm2/s). Each data set represents the mean ± SEM of 3 donors (minimum of 3 cells and 83 trajectories/cell). (G) Fraction of immobile trajectories (<0.002 μm2/s). Each symbol corresponds to an individual cell, red lines are the average value on iDCs and mDCs for each donor (3 donors). (H) Fraction of mobile trajectories (>0.002 μm2/s) classified as confined, sub-diffusive or free. Each symbol corresponds to an individual cell, red lines show the average value on iDCs and mDCs for 3 donors analyzed. (I) Plots showing the center of mass of individual Siglec-1 trajectories (average x,y position in all the frames of a given trajectory) in iDC and mDC. Blue dots correspond to immobile and confined trajectories, and red dots correspond to sub-diffusive and free trajectories. The graph shows all the trajectories analyzed for a minimum of 8 cells per condition from one donor. (J) Distance from the cell center of immobile/confined (black squares) and sub-diffusive/free (empty circles) trajectories in iDC and mDC. Black squares are paired to the empty circles within the same cell. Red symbols correspond to the average values of a minimum of 3 iDC and mDC cells per donor (3 donors). ns, p > R 0.05, * p < % 0.05, ** p < % 0.001; *** p < % 0.0001.
The team has been able to explore the spatial organisation of Siglec-1 on dendritic cell membranes and its important involvement in the early stages of infection using cutting-edge methods including super-resolution imaging and single particle tracking. Researchers have been able to gain a better understanding of the processes that control the interaction between viruses and cells, including the distribution and function of the receptors, by using single-particle tracking techniques and super-resolution microscopy. It’s interesting that the scientists discovered that the development of Siglec-1 nanoclusters, which are essential for improving the capture of HIV-like particles, is triggered by dendritic cell activation.
Though additional study is required to properly understand the intricate relationships and its potential as a therapeutic target, it is still unclear what exactly Siglec-1 does in the setting of HIV-1 infection.
Journal article: Gutiérrez-Martínez., E., et al., 2023. Actin-regulated Siglec-1 nanoclustering influences HIV-1 capture and virus-containing compartment formation in dendritic cells, eLife.
Summary by Stefan Botha