


Currently, the coronavirus disease 2019 (COVID-19) pandemic caused by the SARS-CoV-2 virus has led to the deaths of more than 6.1 million lives worldwide. Researchers have battled the virus through the rapid development of vaccines and treatments, in addition to providing results to better our understanding of the virus through constant research outputs.
It is known that the SARS-CoV-2 spike protein binds with the angiotensin-converting enzyme 2 (ACE2) receptor. This receptor is expressed by several types of cells. Currently, little is known about SARS-CoV-2-specific antibodies of the conjunctival and respiratory mucosae, highlighting the need to study mucosal immunity in response to SARs-CoV-2 infection.
It has been reported that innate and acquired immune responses dictate the onset of mucosal immunity. When the SARS-CoV-2 antigen is detected in the nasal epithelia, it proceeds to the nasopharyngeal-associated lymphoid tissue (NALT). Similarly, if the antigen is present in conjunctival tissue, it proceeds through the conjunctiva-associated lymphoid tissue (CALT). It is here in these tissues that IgA-producing mucosal B-cells are produced. It has been reported that in patients infected with SARS-CoV-2, they possess a high level of serological IgA.
In the present study, Chan et al., investigated mucosal SARS-CoV-2-specific antibody levels and aimed to describe neutralisation in children and adults infected with SARS-CoV-2 (Figure 1). As this was a longitudinal study, the results showed an antibody dominance of IgA in the mucosal response in COVID-19 patients.
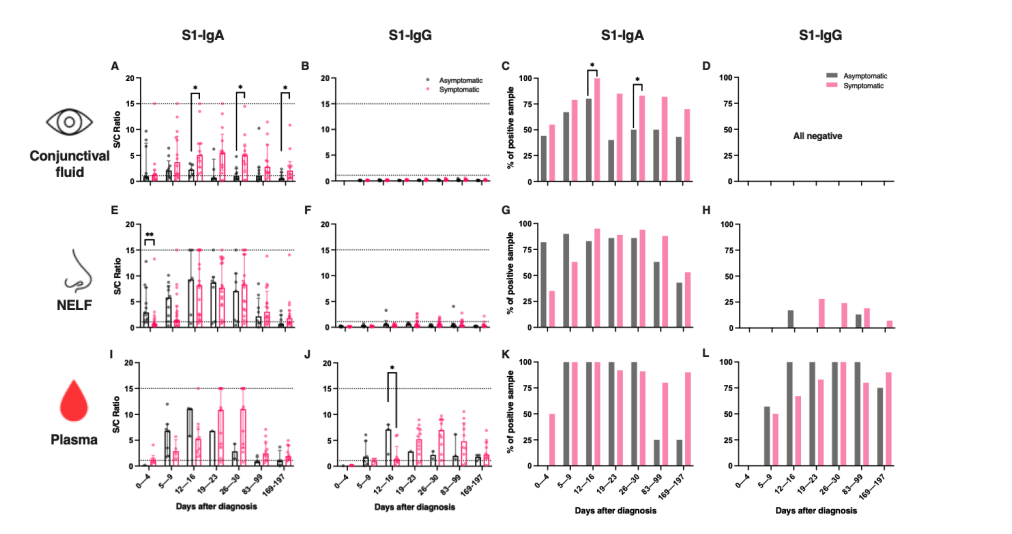
Figure 1: SARS-CoV-2 S1-specific antibody levels and the percentage of positive samples in the (A–D) conjunctival fluid, (E–H) nasal epithelial lining fluid (NELF), and (I–L) plasma of in asymptomatic and symptomatic paediatric patients. Grey and pink symbols indicate data from asymptomatic and symptomatic patients, respectively. Antibody-level data points above the dotted line (sample/calibrator (S/C) ratio ≥ 1.1) are considered as positive, while the dotted lines at y = 15 indicate the upper detection limit of the assay. The median and interquartile ranges are plotted, with dots representing individual values. The percentages denote the IgA and IgG positivity at each time point. The levels of S1-specific Ig were compared between asymptomatic and symptomatic patients via the Mann–Whitney test, while the percentage of positive samples was established by Fisher’s exact test at each time point. The asterisks indicate the statistical differences found; *: p < 0.05 and **: p < 0.01. “No data” indicates that the corresponding time point had no samples available (Chan, et al., 2022).
In their own words:
“In conclusion, our longitudinal study in COVID-19 paediatric and adult patients depicts an independent landscape of mucosal and systemic antibody responses…Our finding provides an important dimension for the diagnostic use of the mucosal antibody measurements, especially for individuals at an early phase of infection and in asymptomatic patients.”
Journal article: Chan, R. W. Y, et al., 2022. Mucosal Antibody Response to SARS-CoV-2 in Paediatric and Adult Patients: A Longitudinal Study. Pathogens.
Summary by Stefan Botha