


In a new study published in Nature Communications, Launonen, et al., have identified and described the mechanism of how ovarian cancer hides from the body’s immune system. These findings have produced novel insights for the development of new targeted therapeutics against the devastating disease.
Approximately 240,000 new cases of ovarian cancers are diagnosed each year which lead to death of over 150,000 women worldwide. Out of all ovarian cancers, high-grade serous ovarian, peritoneal or fallopian-tube cancer (HGSC) is the most common subtype and the cause of 70–80% of all ovarian cancer related deaths.
When tumour cells successfully evade the bodies immunes system, that is when cancer develops. Cancer immunotherapies, a therapeutic approach which is gaining much traction, is a promising therapy for treatment of multiple tumour types. However, ovarian cancer proves to be elusive against immunotherapy at this present moment.
In this present study, researchers made use of novel imaging technology, the to characterise more than 110,000 individual cells from clinical ovarian cancer samples. They looked at how the genetic characteristics of ovarian cancer influenced its effect on the human immune system, and how it influenced the interaction between immune and tumour cell types (Figure 1).
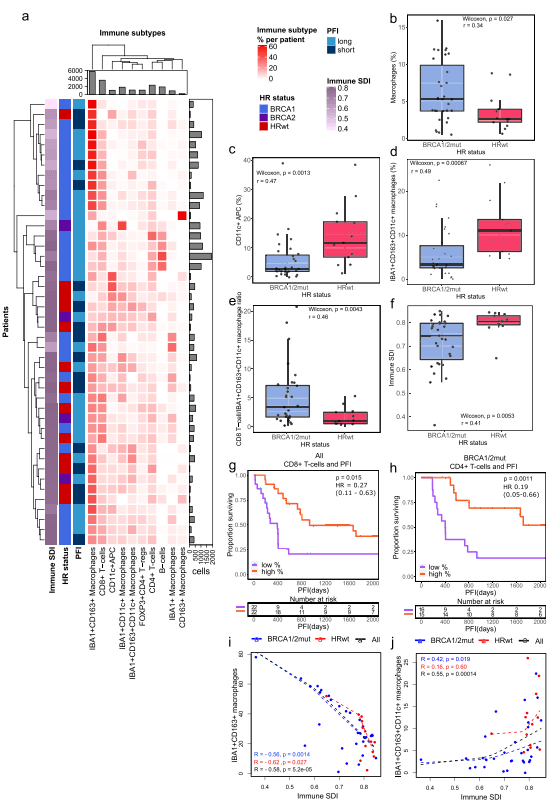
Figure 1: Distinct immune microenvironments associate with immune diversity and clinical outcomes in HGSC. a A hierarchical clustering heatmap of immune subtype proportions out of all immune cells, annotated with immune diversity (immune SDI), and clinical data including HR status and PFI. The barplot annotations for the columns and rows represent the total number of cells per each immune cell subtype and the number of the immune cells in total per patient, respectively. b Boxplot showing the combined proportion of IBA1 + , CD163 + and IBA1 + CD163 + macrophages as a proportion of all cells, stratified by HR status. c Boxplot showing the increased proportion of CD11c + antigen-presenting cells as well as d increased proportion of IBA1 + CD163 + CD11c + macrophages as a proportion of all immune cells in HRwt as compared to BRCA1/2mut tumors e Boxplot showing increased ratio of CD8 + T-cells to IBA1 + CD163 + CD11c + macrophages in BRCA1/2mut as compared to HRwt tumors. f Boxplot showing higher immune diversity in HRwt as compared to BRCA1/2mut tumors. The differences between the boxplot groups were calculated by two-tailed Wilcoxon rank-sum test. The black horizontal lines represent the sample medians, the boxes extend from first to third quartile and whiskers indicate the values at 1.5 times the interquartile range. Individual dots represent values per each tumor (n = 31 BRCA1/2mut, n = 13 HRwt). g Kaplan-Meier graphs for PFI show improved PFI for high CD8 + T-cell proportion in all tumors pooled as well as h for high CD4 + T-cell proportion in patients with BRCA1/2mut tumors. Proportions were calculated out of all cells, and the median value was used to distinguish high and low groups. Number of patients at risk is shown at the bottom of each Kaplan-Meier graph. The comparisons between the groups were performed using the log-rank test. i Scatter plots with lowess regression show negative correlation of immune diversity and the proportion of IBA1 + CD163 + macrophages in all HR groups and j a positive correlation of immune diversity and the proportion of IBA1 + CD163 + CD11c + macrophages in BRCA1/2mut tumors. Proportions were calculated out of immune cells and Spearman correlation coefficients and their p-values are shown (no FDR adjustment). HR groups include BRCA1/2mut (n = 31, blue), HRwt (n = 13, red) tumors and all tumors pooled (n = 44, black). Source data are provided with this paper (Launonen, et al., 2022).
Through the study of individual cells directly in the tissue, they described how cancer cells hide in different ways, depending on the specific gene mutation. They reported that the body’s immune system is more effective against tumours with a mutation in BRCA1/2 genes. Tumours without these mutations have a connective tissue barrier prohibiting the interaction between the cancer and immune cells.
In their own words:
“…single-cell analysis highlights the functional and spatial differences in the TME landscapes of BRCA1/2-deficient and HRwt tumors, underscoring the need for differential treatment strategies for these clinical subgroups. Uncovering the effects of tumor genotypes on the TME, cellular phenotypes, and spatial communities will enable the development of more effective immunotherapeutic strategies and improved patient stratification in HGSC.”
Journal article: Launonen, I-M., et al. 2022. Single-cell tumor-immune microenvironment of BRCA1/2 mutated high-grade serous ovarian cancer. Nature Communications.
Summary by Stefan Botha