


In a recent study, scientists have made great progress in understanding how a novel class of immunotherapeutic drugs known as T cell bispecific antibodies (TCBs) can be used to treat various types of cancer, including leukemias, lymphomas, and myelomas. The U.S. Food and Drug Administration (FDA) has already approved several TCBs for these purposes. TCBs work by tagging tumour cells with one end of the antibody and attracting immune cells with the other end, ultimately leading to the destruction of tumour cells.
One of the challenges in developing TCBs and similar immunotherapy drugs is that the target antigens can be found not only on cancerous cells but also on healthy cells throughout the body. This raises the risk of potentially harming critical organs like the liver, kidney, and others. To address this issue, researchers have created an innovative model for studying the effects of TCBs on kidney tissues.
The team developed a sophisticated in vitro model known as an immune-infiltrated human kidney organoid-on-chip (Figure 1). This model comprises small segments of kidney tissue with blood vessels and forming nephrons, which can be infiltrated by immune cells circulating in the bloodstream. They used this model to investigate the toxicity of a TCB designed to target the tumor antigen Wilms’ Tumor 1 (WT-1), which is also found at lower levels in the kidney.
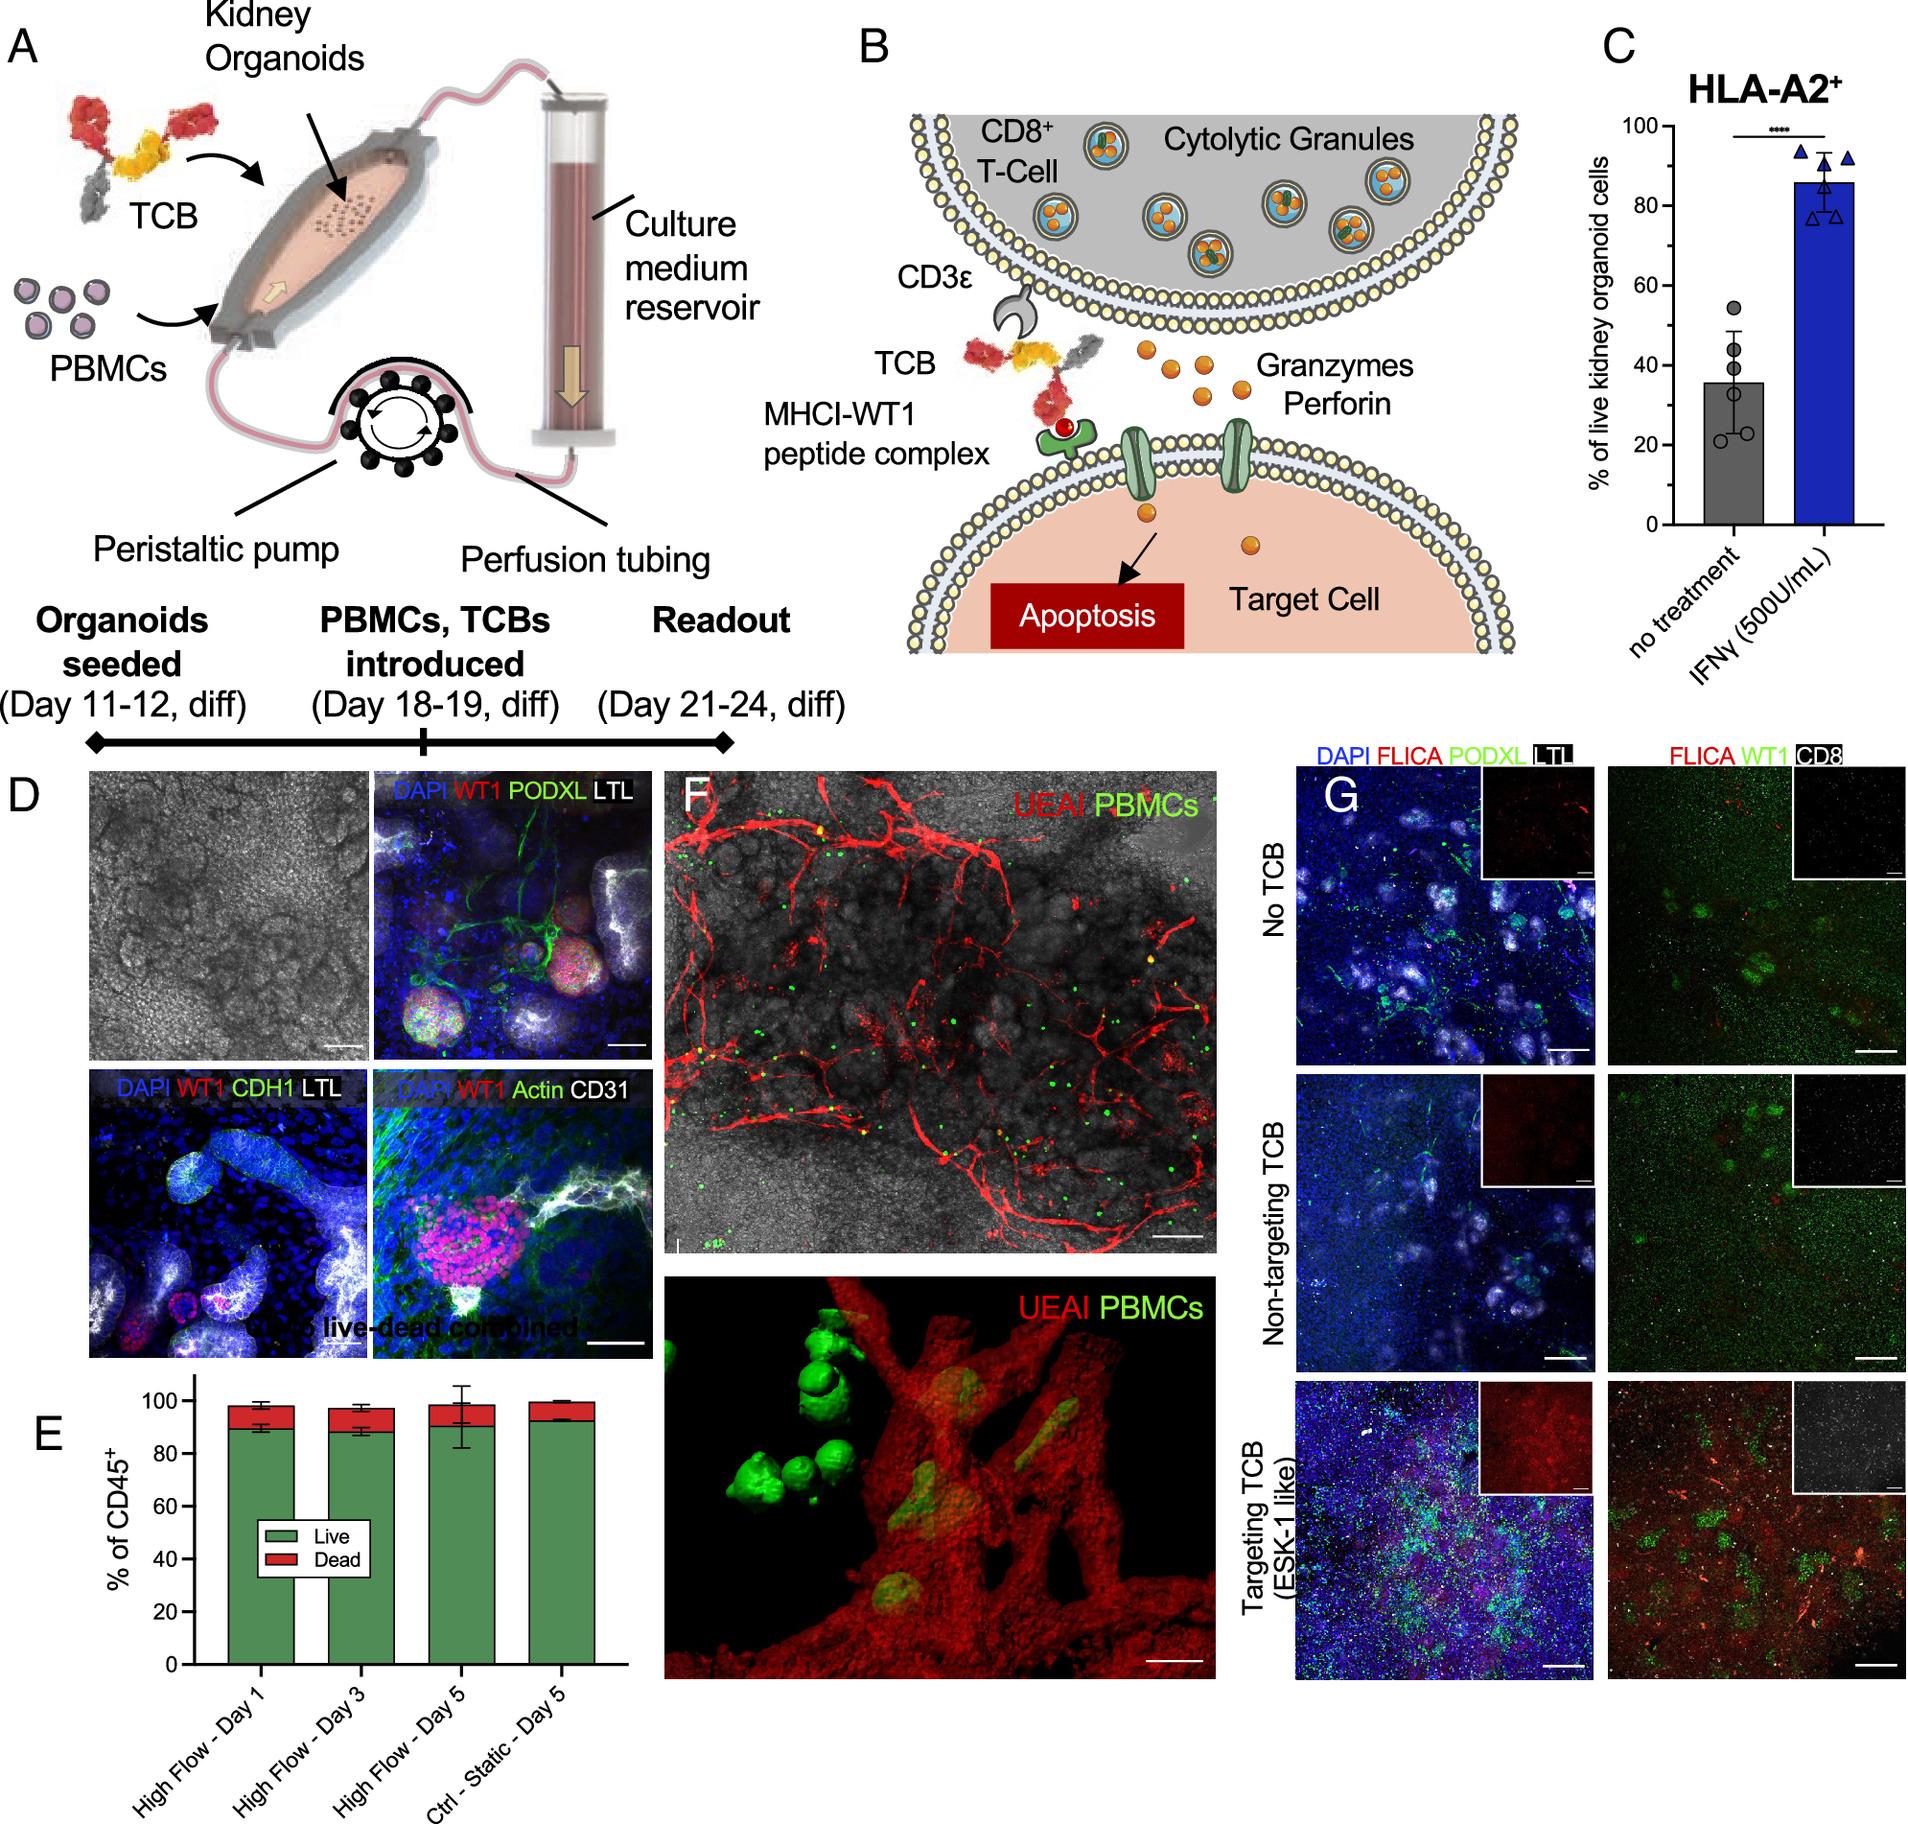
Figure 1: Immune-infiltrated kidney organoid-on-chip model for assessing TCBs. (A) Schematic illustration of the experimental setup. Organoids are seeded onto the millifluidic chip device on their day 11/12 of differentiation and cultured for 7 d under high flow culture conditions. On day 18/19 of kidney organoid differentiation, PBMCs are seeded into the millifluidic chip chamber, the TCB is added to the reservoir, and the chip is cultured under high flow culture conditions for 3 to 5 d until the readout assay is performed. (B) Schematic illustration of the mechanism of action of the TCB antibody: The TCB targets the effector cell, a CD8+ T cell to the cell of interest and the target cell is killed by release of cytolytic granules containing perforins and granzymes. (C) Human leukocyte antigen A2 (HLA-A2) expression quantified by flow cytometry analysis in kidney organoids cultured under high flow with (blue bars) or without (gray bars) 500 U/mL IFNγ for 3 d. **** indicates P < 0.0001 (D) Representative maximum intensity projections of confocal microscopy images showing the WT1 expression in the kidney organoids under high flow culture conditions in respect to the nephron structures of interest. The top left image in each panel is a representative bright-field image of the organoids structure, (scale bar for these grayscale images is 100 μm.) Podocalyxin (PODXL) labels podocytes, lotus tetranoglobus lectin (LTL) labels proximal tubules, E-Cadherin (CDH1) labels distal tubules, and Cluster of Differentiation 31 (CD31) labels endothelial cells. (Scale bar for the immunofluorescence images is 50 μm.) (E) Flow cytometry live/dead analysis of the CD45+ PBMC population under high flow compared to PBMCs in a static dish without organoids (Ctrl–Static). (F) Representative maximum intensity projections of confocal microscopy live images showing the PBMCs (labeled by CellMask™ Green) and the vasculature labeled by UEAI (red) in the kidney organoids under flow (upper image). The lower images show a 3D rendering of the same samples from a higher magnification image (G) Representative maximum intensity projections of confocal microscopy images showing the effect of adding TCBs and PBMCs to kidney organoids under high flow on chip. The kidney organoids in these conditions were cultured in the presence of either no TCB, a nontargeting TCB (DP47), or a targeting TCB (ESK1-like). The samples are stained for either nuclei (DAPI, blue), active caspases (FLICA, red), podocytes (PODXL, green), and proximal tubules (LTL, gray), or active caspases (FLICA, red), Wilms Tumor 1 (WT1, green), and cluster of differentiation (CD8, gray). The insets show either only the active caspases (FLICA, red) or the CD8 infiltration (CD8, gray). (Scale bars are 200 μm.)
The study’s findings revealed that the WT1-TCB selectively killed WT-1-expressing podocytes in the kidney organoids while sparing other cell types in the tubules. This demonstrates the potential of the engineered kidney organoid-on-chip system as a preclinical tool for evaluating the on-target, off-tumor effects of TCBs and other immunotherapeutics.
By employing this innovative model, researchers can gain insights into the specific interactions and toxicities associated with TCBs, advancing the development of safer and more effective immunotherapies for cancer treatment.
Journal article: K.T., Kroll, et al. 2023. Immune-infiltrated kidney organoid-on-chip model for assessing T cell bispecific antibodies. Proceedings of the National Academy of Sciences.
Summary by Stefan Botha