


In a new study, researchers have investigated the level of induction of immunity from four different types of COVID-19 vaccines. They looked at how T-cells, B-cells (not shown), antibody levels change over six months following vaccination (Figure 1,2 and 3). This study was essential for further establishing how COVID-19 work and how effective they still are at providing immunity against the SARS-CoV-2 virus and its variants (READ MORE).
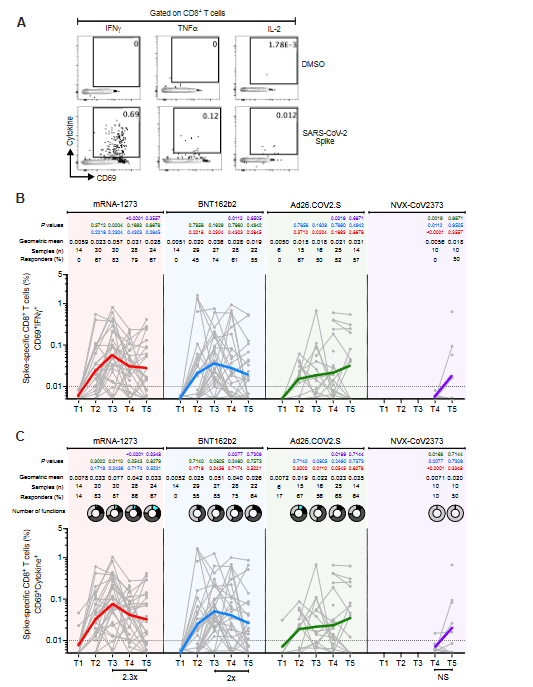
Figure 3: Acute and memory CD8 + T cell responses after mRNA-1273, BNT162b2, Ad26.COV2.S, or NVX-CoV2373 immunization. (A) Representative gating of spike-specific CD8+ T cells. Cytokine-producing (“cytokine+ ”) CD8+ T cells were quantified as CD69+ along with IFNg, TNFa, or IL-2 expression after stimulation with spike MP. (B) Longitudinal quantitation of CD69+ IFNg+ spike-specific CD8+ T cells. See Figure S5 for TNFa and IL-2, and Figure S9 for additional analysis. (C) Longitudinal quantitation of cytokine+ spike-specific CD8+ T cells. CD8+ T cells were quantified as CD69+ along with IFNg, TNFa, or IL-2 expression after stimulation with spike MP. Bottom bars show fold-changes between T3 and T5. The donut charts depict the proportions of multifunctional cytokine+ profiles of the spike-specific CD8+ T cells, including IFNg, TNFa, or IL-2 and GzB: 1 (light gray), 2 (dark gray), 3 (black), and 4 (turquoise) functions (See also Figure S9). The dotted black line indicates the limit of quantification (LOQ). Graphs are color-coded as per Figure 2. Background-subtracted and log data analyzed. Data were analyzed for statistical significance using the Mann-Whitney test [(B), (C)] (Zhang, et al., 2022).
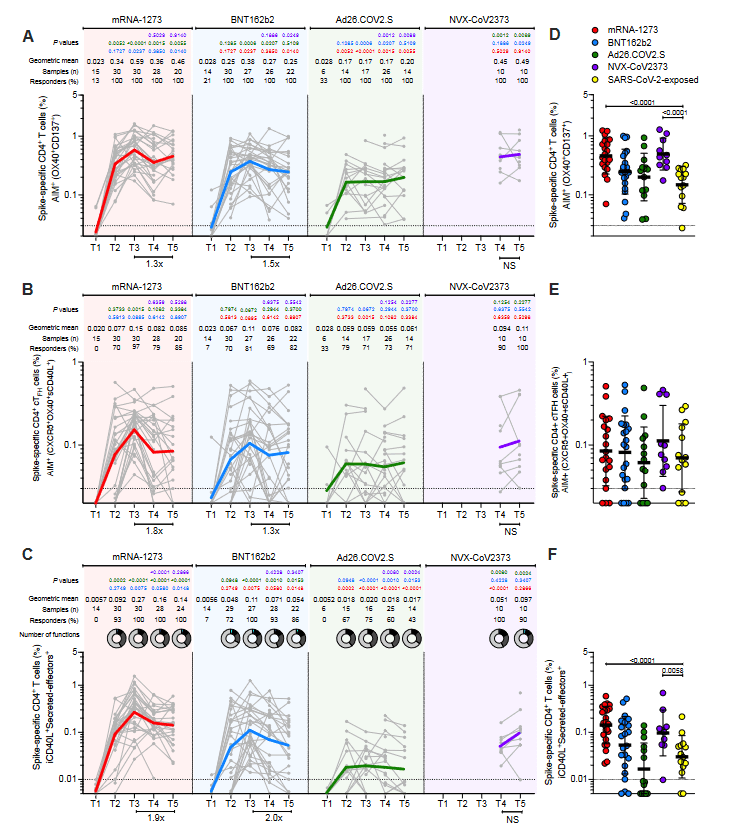
Figure 2: Acute and memory CD4 + T cell responses after mRNA-1273, BNT162b2, Ad26.COV2.S, or NVX-CoV2373 immunization. (A) Longitudinal spike-specific CD4+ T cell responses induced by four different COVID-19 vaccines measured by OX40+ CD137+ AIM after spike megapool (MP) stimulation. See Figures S2B-C for the representative gating strategy of AIM + cells. (B) Longitudinal spike-specific circulating T follicular helper cells (cTfh) induced by COVID-19 vaccines. Spike-specific cTfh cells (CXCR5+ OX40+ sCD40L+ , as % of CD4+ T cells) after stimulation with spike MP. See Figure S2D for representative gating strategy. (C) Spike-specific CD4+ T cells measured by ICS. Expressing iCD40L and producing IFNg, TNFa, IL-2, or GzB (Secreted-effector + = ICS + ). See Figure 4 for analysis of individual IFNg, TNFa, IL-2, or GzB on spike-specific CD4+ cytokine + T cells expressing iCD40L). Donut charts depict the proportions of multifunctional secreted effector profiles among the spike-specific ICS + CD4+ T cells: 1 (light gray), 2 (dark gray), 3 (black), and 4 (turquoise) functions (See also Figure S4). (D-F) Comparison of spike-specific CD4+ T cells by AIM (D), cT FH (E), and ICS (F) between COVID-19 vaccinees at 185 ± 6 days post- vaccination and SARS-CoV-2-exposed subjects 170 to 195 days PSO. The dotted black line indicates the limit of quantification (LOQ). The color-coded bold lines in (A), (C), and (E) represent the geometric mean in each time post-vaccination. Background-subtracted and log data analyzed. P values on the top in (A), (C), and (E) show the differences between each time point in the different vaccines and are color-coded as per Figure 1. Bottom bars in (A), (C), and (E) show fold-changes between T3 and T5. Data were analyzed for statistical significance using the Mann-Whitney test [(A-F)]. NS, non-significant (Zhang, et al., 2022).
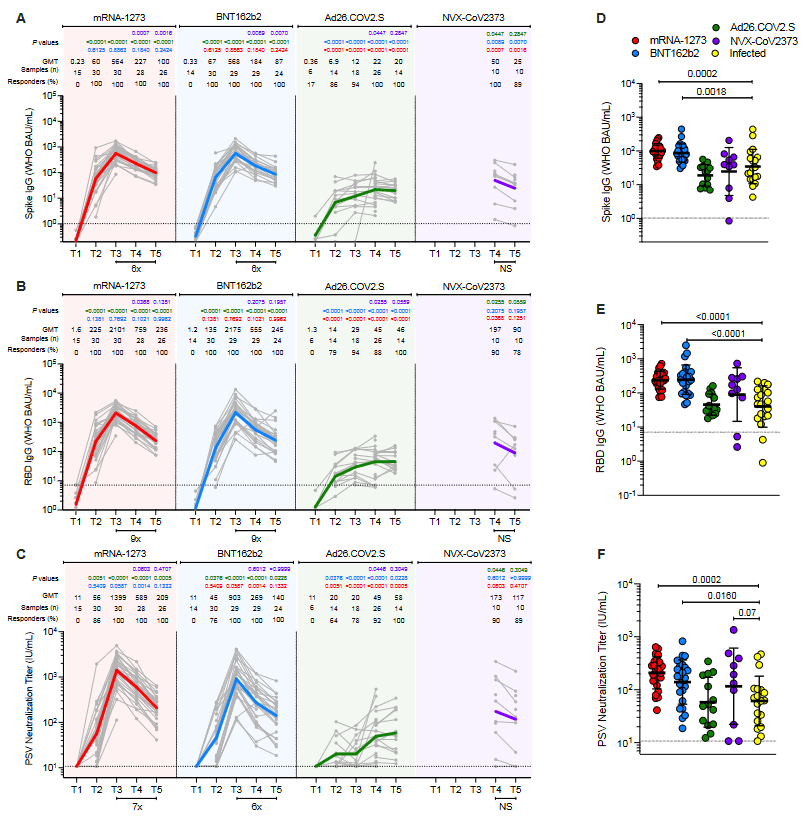
Figure 1: Antibodies elicited by mRNA-1273, BNT162b2, Ad26.COV2.S, and NVX-CoV2373 COVID-19 vaccine platforms. (A-C) (A) Comparison of longitudinal SARS-CoV-2 spike IgG levels, (B) SARS-CoV-2 RBD IgG levels, and (C) SARS-CoV-2 pseudovirus neutralizing titers (PSV) from all donors to the mRNA-1273 (red), BNT162b2 (blue), Ad26.COV2.S (green) and NVX-CoV2373 (purple) COVID-19 vaccines over 6 months. Individual subjects are show as gray symbols with connecting lines for longitudinal samples. Geometric means are shown in thick colored lines. Dotted lines indicate the limit of quantification (LOQ). P values show differences between each time point between the different vaccines, color-coded per comparison based on the vaccine compared. NS, non- significant; GMT, geometric mean titers. Bottom bars indicate fold changes between two time points. (D-F) (D) Comparison of spike IgG, (E) RBD IgG, and (F) PSV neutralization titers at 185 ± 6 days post-vaccination to (Zhang, et al., 2022).
This study is the first known study to investigate the effectiveness of three different vaccine platforms against the same pathogen i.e. a recombinant protein-based adjuvanted vaccine platform (Novavax), viral vector-based platform (Janssen/J&J) and the mRNA platform (Pfizer-BioNTech and Moderna vaccines). These vaccines all target the SARS-CoV-2 spike protein (READ MORE).
They found that after six months, the Moderna vaccine produced the highest levels of neutralizing antibodies in individuals, followed by Pfizer-BioNTech and Novavax vaccines, with the J&J having the lowest level. After six months, those with the mRNA vaccine produced a higher level of B cells than the others. Regarding T-cells, for CD4+ T cells, the levels were all relatively the same with good expression of memory T-cells and for CD8+ T-cells, the Novavax vaccine had the lowest level of “killer” T cells, whilst the rest remained relatively high.
Following six months, only 60-70% retained their immune memory, however the responses would be quickly activated following infection with SARS-CoV-2. Vaccination may not prevent disease, but it will help fight disease. (WATCH)
Journal article: Zhang, Z., et al., 2022. Humoral and cellular immune memory to four COVID-19 vaccines. Cell.
Summary by Stefan Botha