


QuantiFERON-Plus (QFT) testing has almost become a standard component when screening individuals for TB infection (Figure 1). Published work, however, has given evidence which suggests that over two-third of patients with ‘borderline’ test results i.e. negative QFT results just below the cut-off, are in fact also infected with TB. In this paper, the authors therefore sought to identify a biomarker profile that can be used to differentiate borderline QFT results, due to TB-infection, from those that are a result of random test variation.
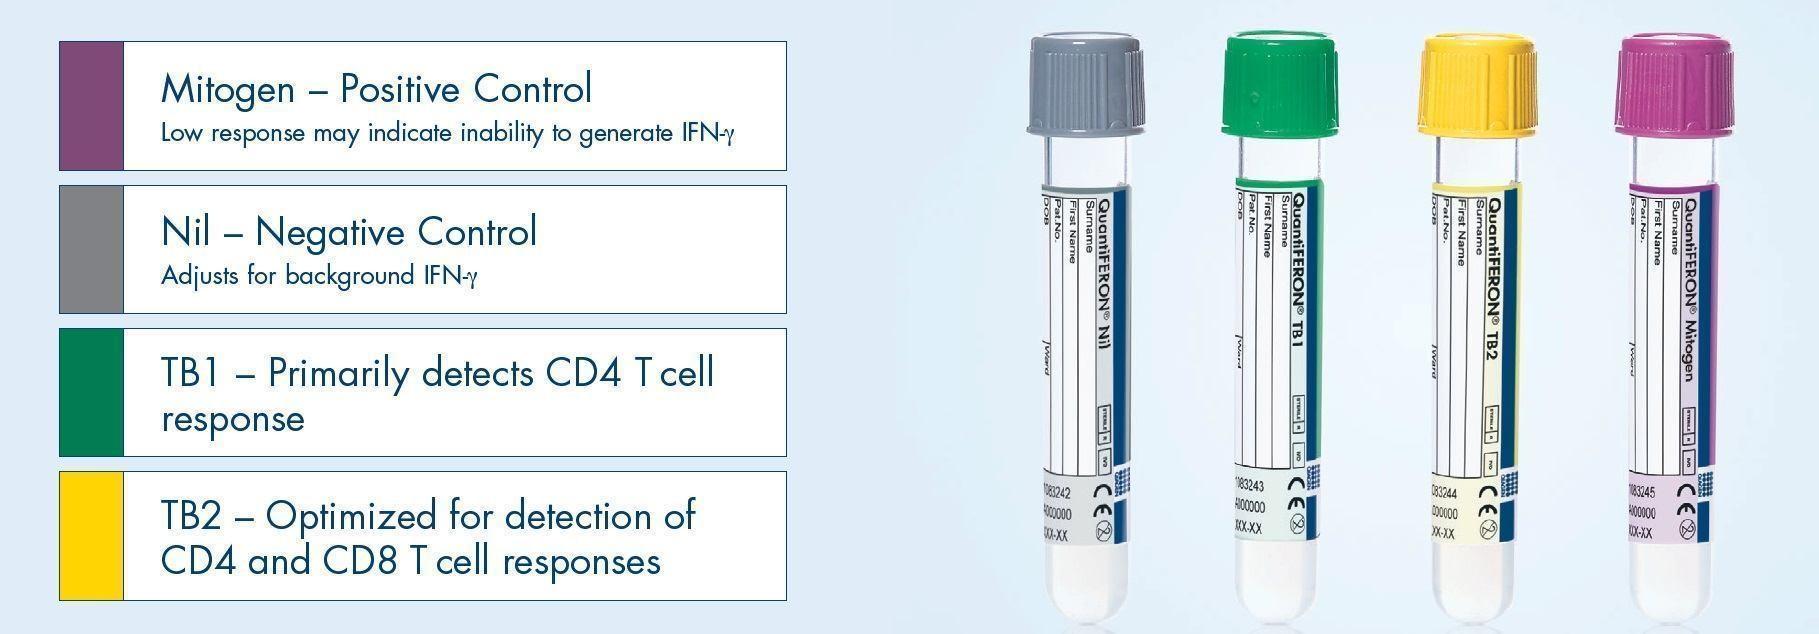
Figure 1: QuantiFERON-TB Gold Plus (QFT-Plus) is a simple blood test that aids in the detection of Mycobacterium tuberculosis, the bacteria which causes tuberculosis (TB). CD8+ T cells have been shown to play an important role in Mycobacterium tuberculosis immunity (9–11). QFT-Plus now measures the cell-mediated immune response to tuberculosis infection from both CD4+ and CD8+ T cells. The new TB1 tube primarily detects CD4+ responses, while TB2 is optimized for both CD4+ and CD8+ responses. (Source of information and the picture: https://www.quantiferon.com/products/quantiferon-tb-gold-plus-qft-plus/).
The study involved QFT tests from 195 samples that were collected from laboratory sites at three different hospitals. Uzorka et al targeted to include twice as many individuals with a borderline QFT result as those with a negative or positive QFT result. Based on other published work, borderline limits for QFT results were set at ≥0.15 and <0.35 IU/ml.
A panel of 48 cytokines, chemokines and growth factors were analysed using a bead-based multiplex assay. With the exception of Interferon gamma, global test analysis was performed on all other biomarkers on the panel where IP-10, MIG and IL-1ra emerged as those whose levels were significantly higher in patients with TB-infection compared to those with a low-negative QFT result.
The ability of all three biomarkers to correctly classify individuals in this study yielded an AUC of 0.97 [95% CI: 0.92-1.00] along with a high sensitivity and specificity of: 1.00 [95% CI: 0.79-1.00] and 0.95 [0.74-1.00]. The prediction model that was eventually built came to include just IP-10 and MIG. Without the model in play, further analysis of just borderline QFT results showed that close to two-thirds of individuals with a borderline result had both IP-10 and MIG levels above the cut-offs designed for TB infection.
Based on these results and those of others, Uzorka et al do feel that there is an urgent need for IP-10 and/or MIG assays on the market as these could increase the diagnostic sensitivity for TB-infection, particularly for individuals with borderline QFT results. They do, however, also highlight the issue of clinical relevance of their findings, which they think has to be thought about in relation to an individual’s risk of progressing to active TB alongside the overall benefit of giving preventive treatment versus the harm of its potential side effects.
Journal article: Uzorka, J.W., et al., 2022. Biomarkers to identify Mycobacterium tuberculosis-infection among borderline QuantiFERON results. European Respiratory Journal.
Summary by Vanessa Mwebaza Muwanga