


In a recent study, scientists have provided new insights into B-cell activation and its impact on T-cell potential. By employing advanced molecular techniques researchers investigated various types of B-cells during the growth of melanoma and monitored gene expression patterns (Figure 1). Surprisingly, they found that the depletion of B-cells overall led to a substantial increase in melanoma tumour growth.
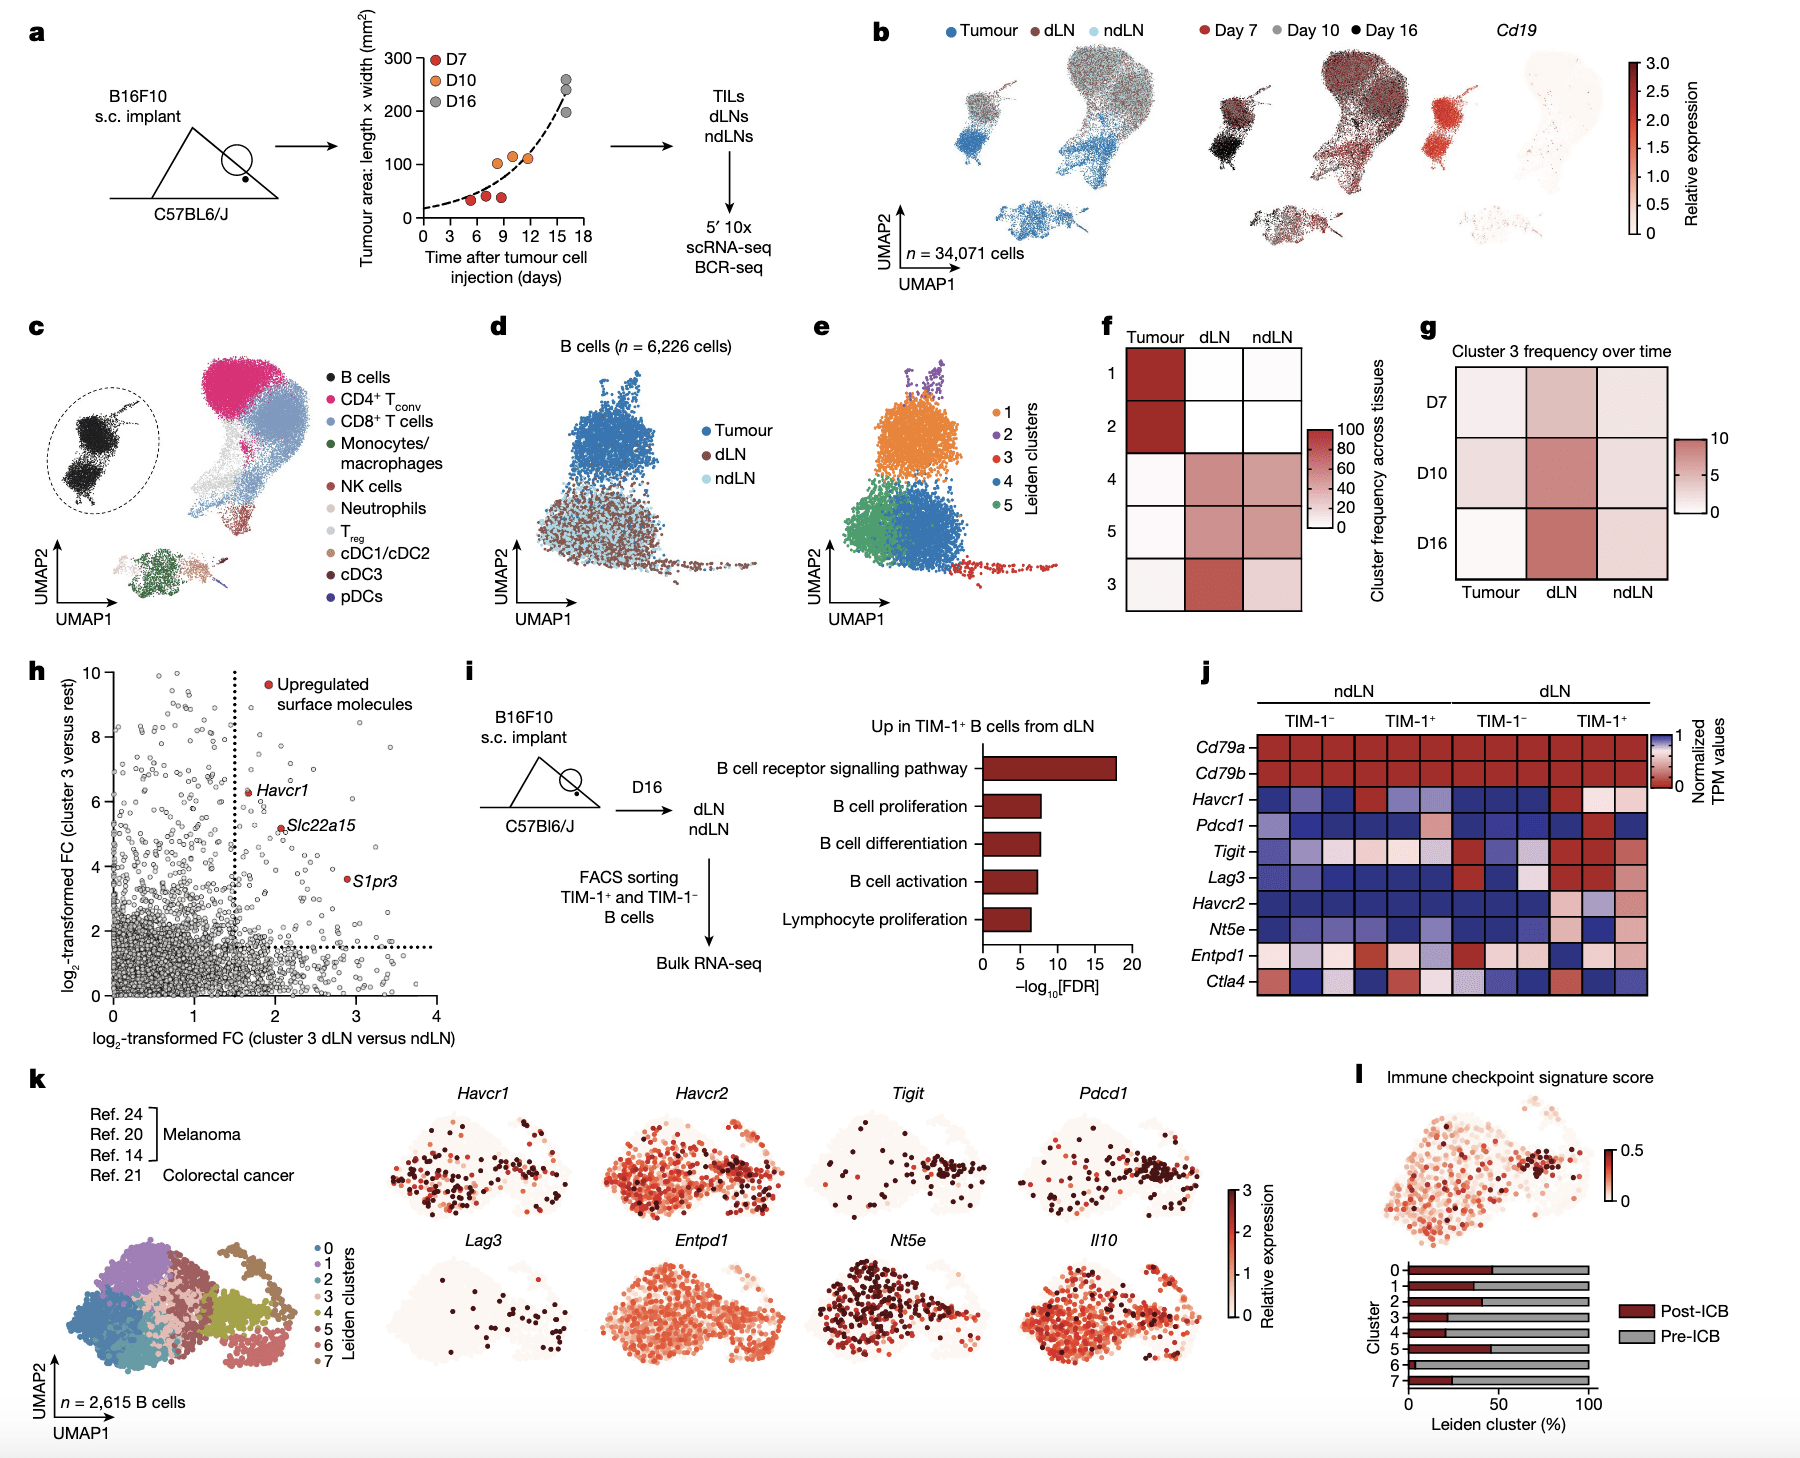
Figure 1: Characterization of B cells expressing TIM-1 and several checkpoint molecules in mouse melanoma and human tumours. a, Workflow for single-cell transcriptome profiling of 34,071 viable leukocytes from TME, dLN and ndLN samples. n = 3 mice per time point (days 7 (D7; early), 10 (intermediate) and 16 (late)). s.c., subcutaneous. b, Uniform manifold approximation and projection (UMAP) embedding of all cells sequenced with each colour representing tissues of origin (left), timepoint (centre) and expression of Cd19 (right). c, UMAP visualization of the immune cell types. CD4 + Tconv, conventional CD4 + T cells; cDC1/2/3, type 1, 2 and 3 conventional dendritic cells; NK, natural killer. d,e, UMAP visualization of the 6,226 B cells (dots) collected from wild-typemice bearing B16F10 melanoma, depicting tissues of origin (d) or Leiden cell clusters (resolution 0.85) (e). f,g, The frequencies of cells from each cluster within the tissues of origin (f) or from cluster 3 over time and tissues of origin (g). h, The log 2-transformed fold change (FC) in RNA levels between B cells derived from cluster 3 with the rest of the clusters and between the dLN and ndLN. i,j, Bulk RNA-seq analysis of TIM-1+ and TIM-1− B cells derived from dLNs and ndLNs of B16F10-bearing wild-type mice. n = 3. i, Pathway enrichment analysis of dLN-derived TIM-1+ B cells. FACS, fluorescence-activated cell sorting; FDR, false-discovery rate. j, The expression pattern of a set of selected genes. k,l, UMAP plot of published scRNA-seq 14,20,21,24 data depicting 2,615 B cells (dots) isolated from human tumours, coloured by cell clusters (k, left), selected gene expression (k, right) and immune checkpoint signature score (l, top), and a stacked bar graph displaying the frequencies of B cells derived from responder and pre- and post-ICB samples among each Leiden cluster (l, bottom).
Further investigation revealed the presence of a specific subset of B-cells that expanded specifically in the draining lymph node of tumour-bearing mice. These B-cells expressed a cell surface molecule called TIM-1, which is encoded by the Havcr1 gene. Additionally, this subset expressed co-inhibitory molecules like PD-1, TIM-3, TIGIT, and LAG-3. Intriguingly, deleting the co-inhibitory molecules on B-cells had minimal impact on tumour burden. However, selectively deleting Havcr1 in B-cells significantly inhibited tumour growth.
The absence of TIM-1 due to the loss of Havcr1 resulted in heightened B-cell activation and antigen presentation, leading to the expansion of tumour-specific T-cell activity. Moreover, the administration of a commercially available anti-TIM-1 antibody effectively inhibited tumour growth. Interestingly, the removal of the Havcr1 gene from T-cells had no effect, highlighting the crucial role of B-cells in this process. The expression of TIM-1 by this specific subset of B-cells appears to function as a regulatory checkpoint, preventing excessive activation of the immune system in response to tumours.
These findings open exciting possibilities for therapeutic interventions. Manipulating or suppressing TIM-1-expressing B-cells could offer a valuable advantage by enabling the immune system to mobilize anti-tumour immunity and effectively hinder tumour growth.
Journal article: Bod, L., et al. 2023. B-cell-specific checkpoint molecules that regulate anti-tumour immunity. Nature.
Summary by Stefan Botha