


T cells are central to the immune system, mounting specialized responses that include killing infected cells, releasing cytokines, or driving inflammation. Traditionally, immunologists have described T cell function in terms of distinct categories, such as TH1, TH2, or TH17 subsets, each with its own signature gene program. But advances in single-cell RNA sequencing (scRNA-seq) have revealed a more complex picture: instead of discrete boxes, T cells often exist along a continuum of overlapping states (Figure 1).
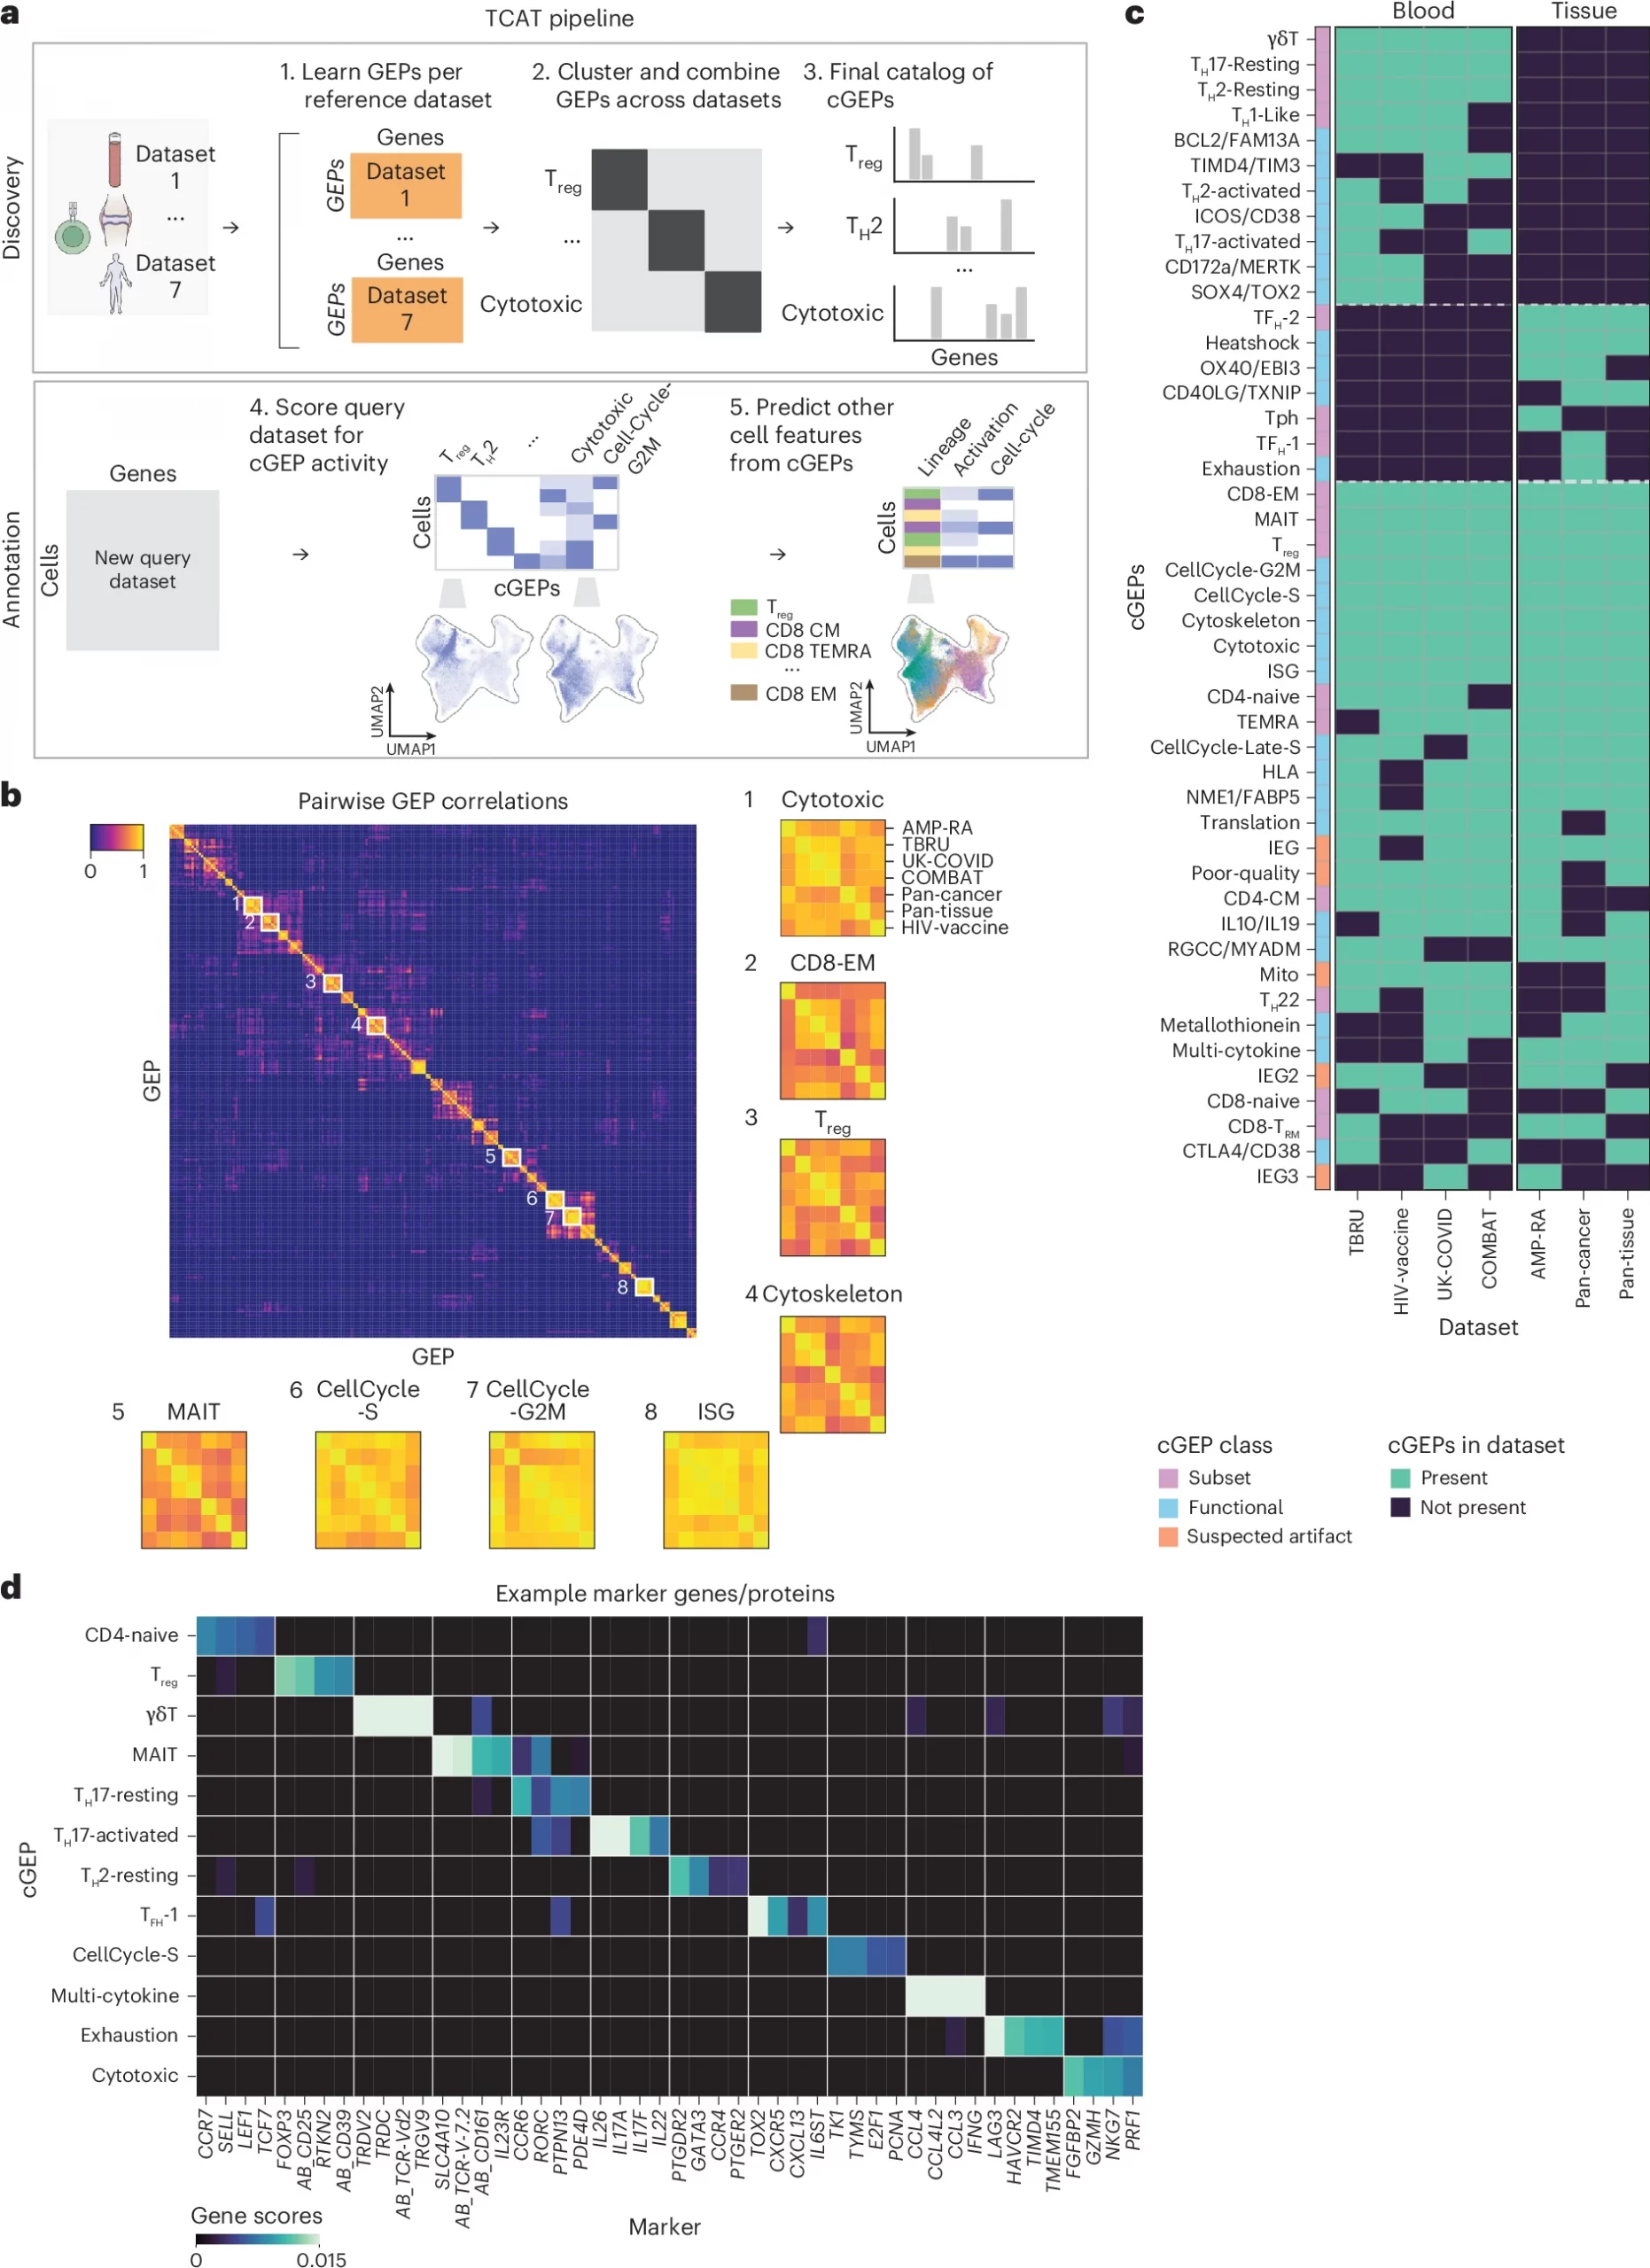
Figure 1: Overview of starCAT. a, starCAT first identifies GEPs in multiple datasets and aggregates them into cGEPs. It then uses the cGEPs to annotate new query datasets and compute additional scores and classifiers. b, Pairwise correlations of GEPs discovered across reference datasets with insets for cGEPs derived from all seven references. Inset row and column orders are the same for all cGEPs. c, Heat map of cGEPs (rows) and which datasets the comprising GEPs were found in (columns). Green boxes indicate a GEP was found in a dataset. Colored bar indicates the cGEP’s assigned class. cGEPs corresponding to non-T cell lineages are excluded. d, Marker genes for selected example cGEPs in z-score units with the minimum value fixed at 0. The AB_ prefix indicates a surface protein.
In a new study researchers introduce T-CellAnnoTator (TCAT), a computational pipeline designed to make sense of this complexity by quantifying gene expression programs (GEPs) across millions of single cells. Rather than forcing cells into rigid categories, TCAT captures combinations of functional states, providing a richer and more flexible framework for understanding T cell biology.
The team analysed an enormous dataset of 1.7 million T cells collected from 700 individuals, spanning 38 tissues and five disease contexts. From this, they identified 46 reproducible GEPs representing fundamental aspects of T cell behaviour, including proliferation, cytotoxicity, exhaustion, and effector responses. These patterns were consistent across datasets and contexts, establishing a standardized “map” of T cell functions.
Importantly, the researchers went beyond computational predictions: they experimentally validated new activation programs, confirming that the pipeline uncovers biologically meaningful states. They also demonstrated the clinical utility of TCAT by showing that certain activation GEPs can predict patient response to immune checkpoint inhibitors across multiple types of cancer.
To make the approach broadly accessible, the authors developed a generalizable software package called starCAT, which extends the TCAT framework beyond T cells, enabling reproducible annotation of other immune and non-immune cell types across tissues and disease settings.
By redefining how T cells, and potentially all cell types, are annotated, this study provides a powerful new lens for dissecting immune responses in health and disease. It could guide not only basic immunology but also the design of immunotherapies and biomarkers that hinge on understanding subtle but crucial shifts in cell states.
Journal article: Kotliar, D., et al. 2025. Reproducible single-cell annotation of programs underlying T cell subsets, activation states and functions. Nature Methods.
Summary by Stefan Botha