


Diabetes mellitus (DM) has been rated among one of the major risk factors, worldwide, for not only infection with Mycobacterium tuberculosis, but also progression to active TB disease. This has ideally warranted research that has gone on to try and find out how DM causes this and also identify people with DM who may already be progressing to the point of TB disease so that timely preventative treatment can be given.
The field of transcriptomics has opened up the possibility of non-sputum-based biomarker tests for TB diagnosis and has affirmed some of what we already know about the immune response to TB i.e. it is driven by the presence of inflammatory markers and is hallmarked by a strong type I interferon response. With the expansion of what we know about transcriptomics shifting to the possibility of being able to monitor how individuals respond to TB treatment, the authors sought to identify what the transcriptomic landscape looks like for people with TB and DM during TB treatment.
Individuals with TB, with or without DM were recruited from 3 different countries that are part of the TANDEM study. All patients received first line TB treatment and majority of those with DM as well did receive standard treatment.
Gene expression between people with TB and TB-DM comorbidity was analysed using the poly-A tail Bioscientific NEXTflex-Rapid-Directional mRNA-seq method. This was carried out on venous blood samples collected from individuals at the point of recruitment and at four time points during treatment. The perturbation in gene expression was noted to be different between the TB-only and TB-DM groups. Changes in gene expression were more evident in the TB-only group, noticeable from week 2 of treatment. While this also occurred in the TB-DM group, it was at a reduced magnitude.
MaSigPro is an R analysis package used to find genes that are significantly and differentially expressed between between experimental groups in time course microarray and RNA-Seq experiments. Using the MaSigPro, 167 genes were found to be differentially expressed in both TB and TB-DM groups. Using hierarchical clustering, these genes were placed into 9 clusters, as shown in Table 1, based on similar expression patterns. Modular analysis was performed between TB-DM and TB-only patients where immune activation was found to be the top module in both populations since it was upregulated in TB-DM group compared to TB-only throughout treatment.
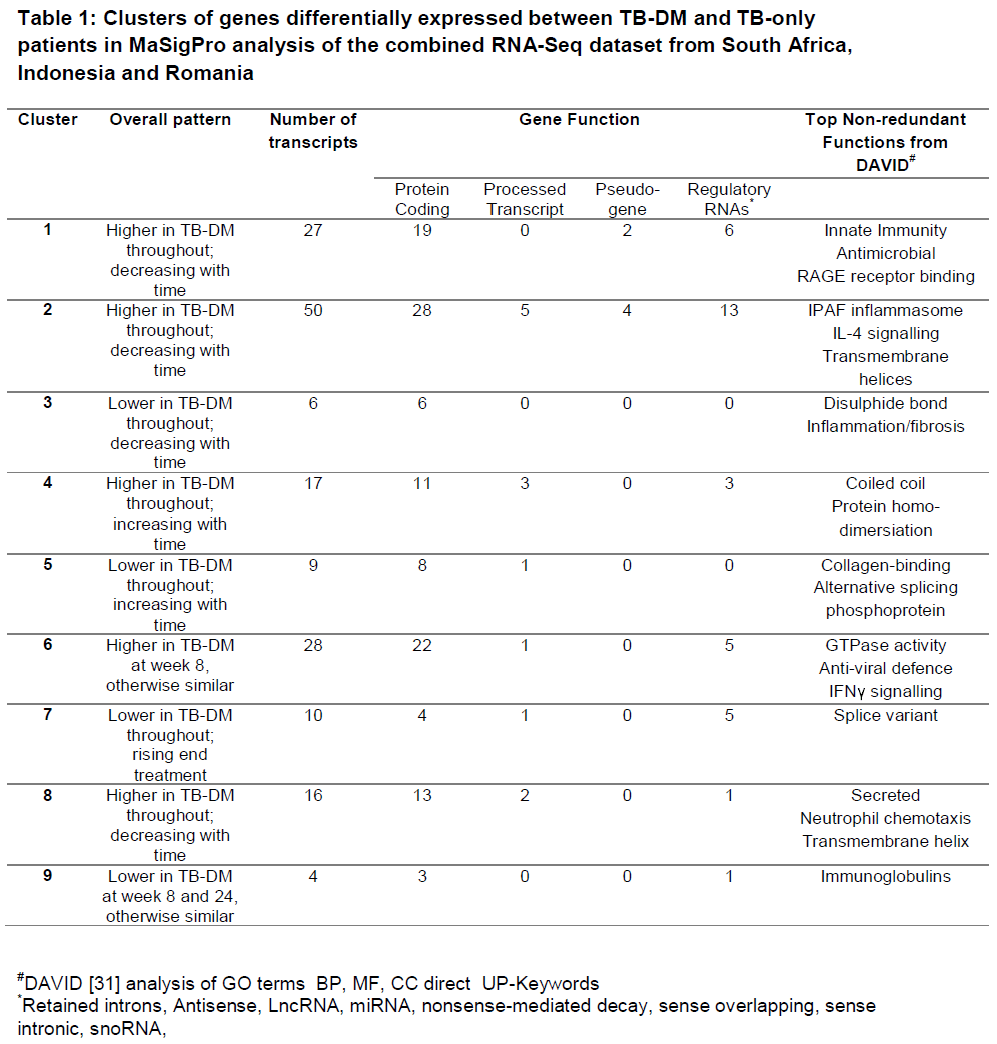
#DAVID [https://genomebiology.biomedcentral.com/articles/10.1186/gb-2003-4-9-r60] analysis of GO terms BP, MF, CC direct UP-Keywords. *Retained introns, Antisense, LncRNA, miRNA, nonsense-mediated decay, sense overlapping, sense intronic, snoRNA.
The gene clusters identified from their data do exhibit similar changes between disease groups, just at different magnitudes. This would reflect the fact that inflammation and immune activation going on from the point of diagnosis in TB-DM patients would need to see them have a longer treatment period to have their inflammation resolve completely, or to the same level as patients with TB only. TB-DM individuals could also be put on a different set of treatment so that they do not easily succumb to possible TB recurrence later on. Host-directed or anti-hyperglycaemic therapy given to DM-TB patients, those that are pre-diabetic or have IH, on top of standard TB treatment, can be an additional step taken to help dampen the pro-inflammatory response present.
As transcriptomic signatures originally developed and tested for just people with TB are noted to have altered expression in people with DM or intermediate hyperglycemia, the authors wanted to identify a signature that could differentiate between patients at diagnosis and at the end of TB treatment regardless of their diabetic status. Using data from 2 countries in the study, they developed a 15-gene signature (Table 2) with an AUC of 0.88 for TB-only, 0.96 for TBrel-IH (TB-related intermediate hyperglycaemia) and 0.85 for the TB-DM group. The signature looks at predicting treatment response up to 6-month mark. It would be good to see any further work done to gain insight into what the transcriptional landscape looks like and how much it is impacted in individuals that are on treatment for a far prolonged time period.
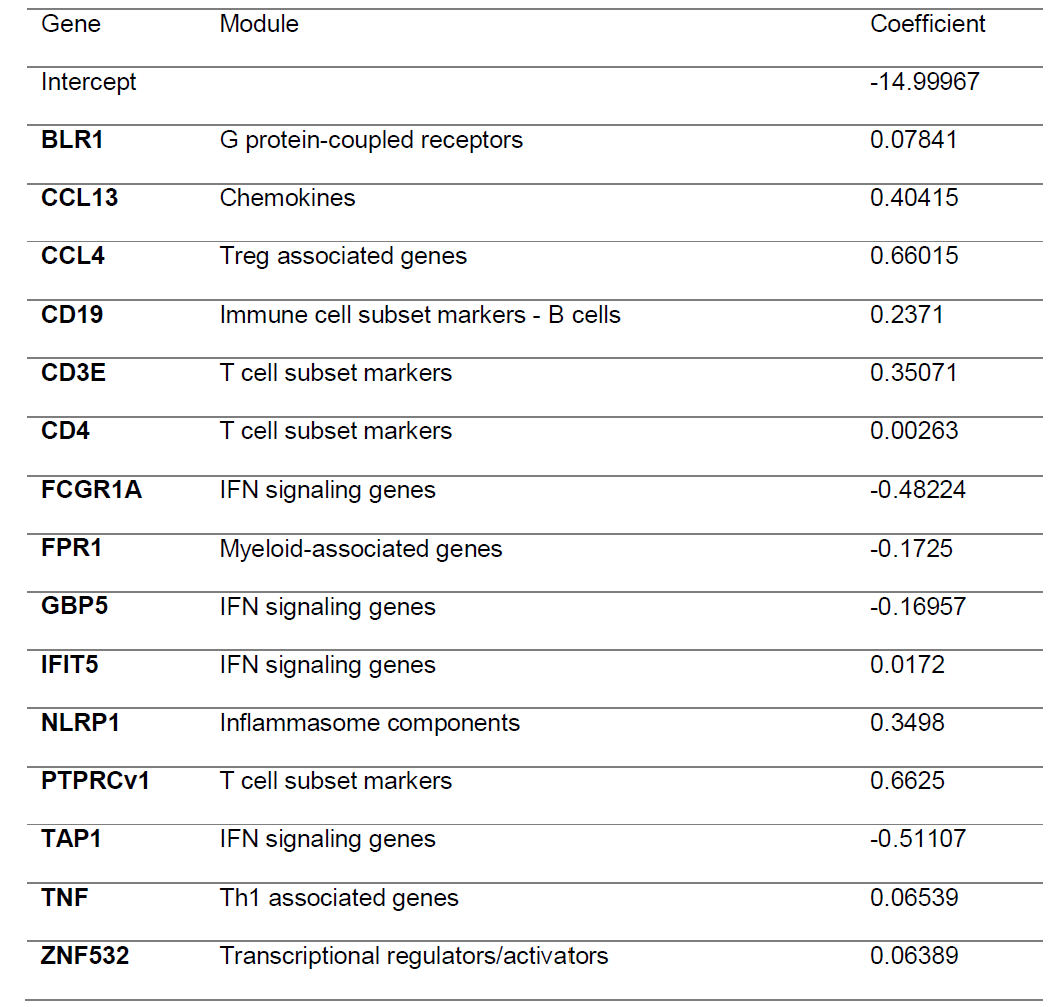
Table 2: Gene expression signature predicting month 6 versus diagnosis, obtained by pooling the study groups and cohorts (South Africa + Indonesia). The signature was developed using logistic regression with lasso regularisation. Initially, signatures were developed in the South African and Indonesian cohorts separately however, the classifying capability was low. To improve the classification performance and reduce cohort dependency, the datasets of both cohorts were pooled, leading to combined two cohort 15-gene signature above being developed.
NB to note: medRxiv is a preprint server which publishes preliminary scientific reports that are not peer-reviewed and, therefore, should not be regarded as conclusive, or guide clinical practice or treated as established information.
Journal article: Eckold et al., 2022. Impaired resolution of blood transcriptomes through tuberculosis treatment with diabetes comorbidity. medRxiv.
Summary by Vanessa Mwebaza Muwanga