


A recent study had researchers show that SARS-CoV-2 is capable of infecting human fat tissue (Figure 1). In this study they looked at fat tissue biopsied from patients undergoing bariatric and cardiac surgeries. The tissues were later infected with SARS-CoV-2. Further confirmation was seen in adipose tissue of patients who had succumb to COVID-19.
Figure 1: SARS-CoV-2 RNA and immune infiltration are present in adipose tissue of autopsy samples from patients with COVID-19. (A to E) RNA in situ hybridization (ISH) on epicardial fat from heart autopsies from patients with COVID-19 are shown. (A and B) show samples from autopsy #9. (C to E) show samples from autopsy #10. Assays were performed using probes against SARS-CoV-2 spike mRNA. Black arrowheads show ISH positive signals and gray arrows show inflammatory cells. (A and C) Overview of the heart tissue section (2mm), and (B and D) magnified view (20μm) of the represented region. (E) Interface of epicardial fat and myocardium (50μm). Note the inflammatory infiltration (gray arrows) only in the epicardial fat. Image has been rotated 90°.
As obesity is a risk factor for those infected with SARS-CoV-2, it is important to establish how and why obesity would lead to an increased risk of severe disease. In this study, the researchers were able to show how COVID-19 directly infected adipose tissue, inducing a significant inflammatory response in immune cells within the tissue. It has been reported that Obese individuals are up to ten times more likely to succumb to COVID-19.
Adipose tissue contains, besides fat cells, a complex and varied population of immune cells including macrophages. Infection of adipose tissue by SARS-CoV-2 causes a change in macrophage activity within the tissue inducing inflammation and the expression of inflammatory markers which induce inflammation in neighbouring cells i.e. bystander cells (uninfected cells). As adipose tissues are essential in insulation, they surround vital organs. Inflammation in this tissue can have significant effects on these organs.
It was also found that ACE2, the receptor which plays a key role in SARS-CoV-2 pathogenesis, played no significant role in the infection of fat cells by the virus (Figure 2).
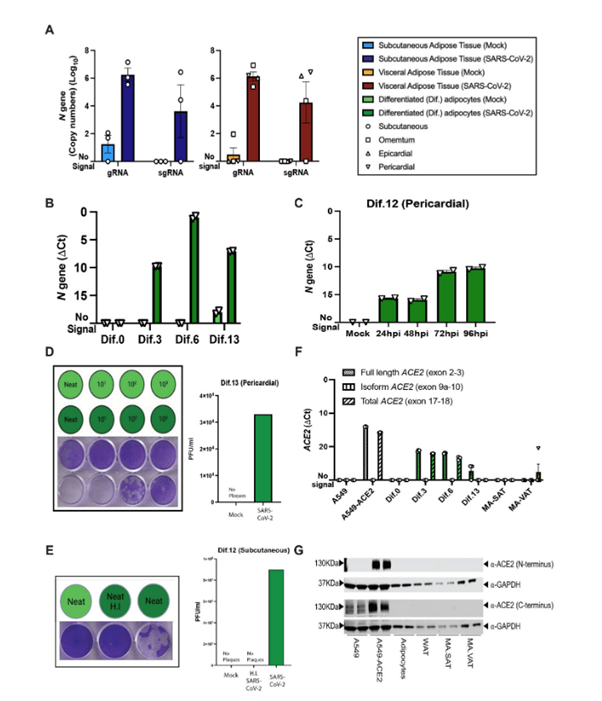
Figure 2: Mature and in vitro differentiated adipocytes support SARS-CoV-2 infection in the absence of ACE2 protein. Mature adipocytes (MA) from fresh human adipose tissue were isolated by collagenase digestion and infected with SARS-CoV-2 (USA-WA1/2020) at a MOI of 1, or mock-infected, for 1 hour followed by washing and culturing prior RNA collection. (A) Measurements of absolute SARS-CoV-2 (N gene) genome copy numbers of genomic (gRNA) and subgenomic (sgRNA) RNA are shown for mature adipocytes from subcutaneous (left; n=3) and visceral (right; n=2 omentum; n=1 epicardial; n=1 pericardial) adipose tissue at 24 hours post-infection (hpi). (B) SARS-CoV-2 N gene ΔCt values are shown at 24 hpi for adipocytes differentiated from pericardial adipose tissue for 0, 3, 6, and 13 days (Dif.0, 3, 6, 13). (C) SARS-CoV-2 N gene ΔCt values are shown at 24, 48, 72, and 96hpi for adipocytes differentiated from pericardial adipose tissue. In (B and C), each data point is an average of 2 technical replicates and are presented as mean ± s.e.m. (D) Plaque assay results are shown for supernatants collected from day 13 differentiated (Dif.13) adipocytes from pericardial adipose tissue that were either mock infected (top row, light green) or infected with SARS-CoV-2 (bottom row, dark green). Tested samples were either neat (undiluted) or serial 10-fold dilutions. Bar plot quantification of measured plaque forming units (PFU)/ml on the right. (E) Plaque assay results are shown for supernatant collected from day 12 differentiated (Dif.12) adipocytes from subcutaneous adipose tissue that were treated with heat inactivated (H.I) SARS-CoV-2 (middle, dark green), SARS-CoV-2 (right, dark green) or mock-infected (left, light green). Bar plot quantification of measured PFU/ml on the right. (F) ACE2 RNA expression was measured in A549 cells, A549-ACE2 cells, differentiated adipocytes, whole adipose tissue (WAT), and mature adipocytes from subcutaneous (MA-SAT) and visceral (MA-VAT) adipose tissue using primers targeting the exon 2 to 3 (Full length), exon 9a to 10 (isoform), and exon 17 to 18 (total) of ACE2. Each data point in A549 cells, A549-ACE2 cells, differentiated adipocytes, and whole adipose tissue are averages of technical replicates. Values in MA-SAT (n=3) and MA-VAT (n=4) are from independent donors. (G) ACE2 protein expression was evaluated by Western blot analysis on cell types as in (F), using antibodies against the N and C terminus of ACE2. GAPDH was used as a loading control. Absolute gene quantification in (A to C) was obtained using a standard curve generated with N gene insert. In all cases RTqPCR analyses, ΔCt values were obtained by 1-step RTqPCR using 18s as a housekeeping gene and data are presented as mean ± s.e.m. Color legend on the top right applies to all panels.
This study provides vital information into the pathogenesis of SARs-CoV-2 and may provide us with the tools we need to battle the virus on a new front.
Journal article: Martínez-Colón, G.J., et al., 2022. SARS-CoV-2 infection drives an inflammatory response in human adipose tissue through infection of adipocytes and macrophages. Science Translational Medicine.
Summary by Stefan Botha