


Researchers have uncovered a key mechanism controlling CD8⁺ T cell infiltration into atherosclerotic plaques (Figure 1), highlighting a potential therapeutic target for cardiovascular disease. The findings reshape our understanding of immune involvement in atherosclerosis, beyond the classical focus on macrophages and foam cells.
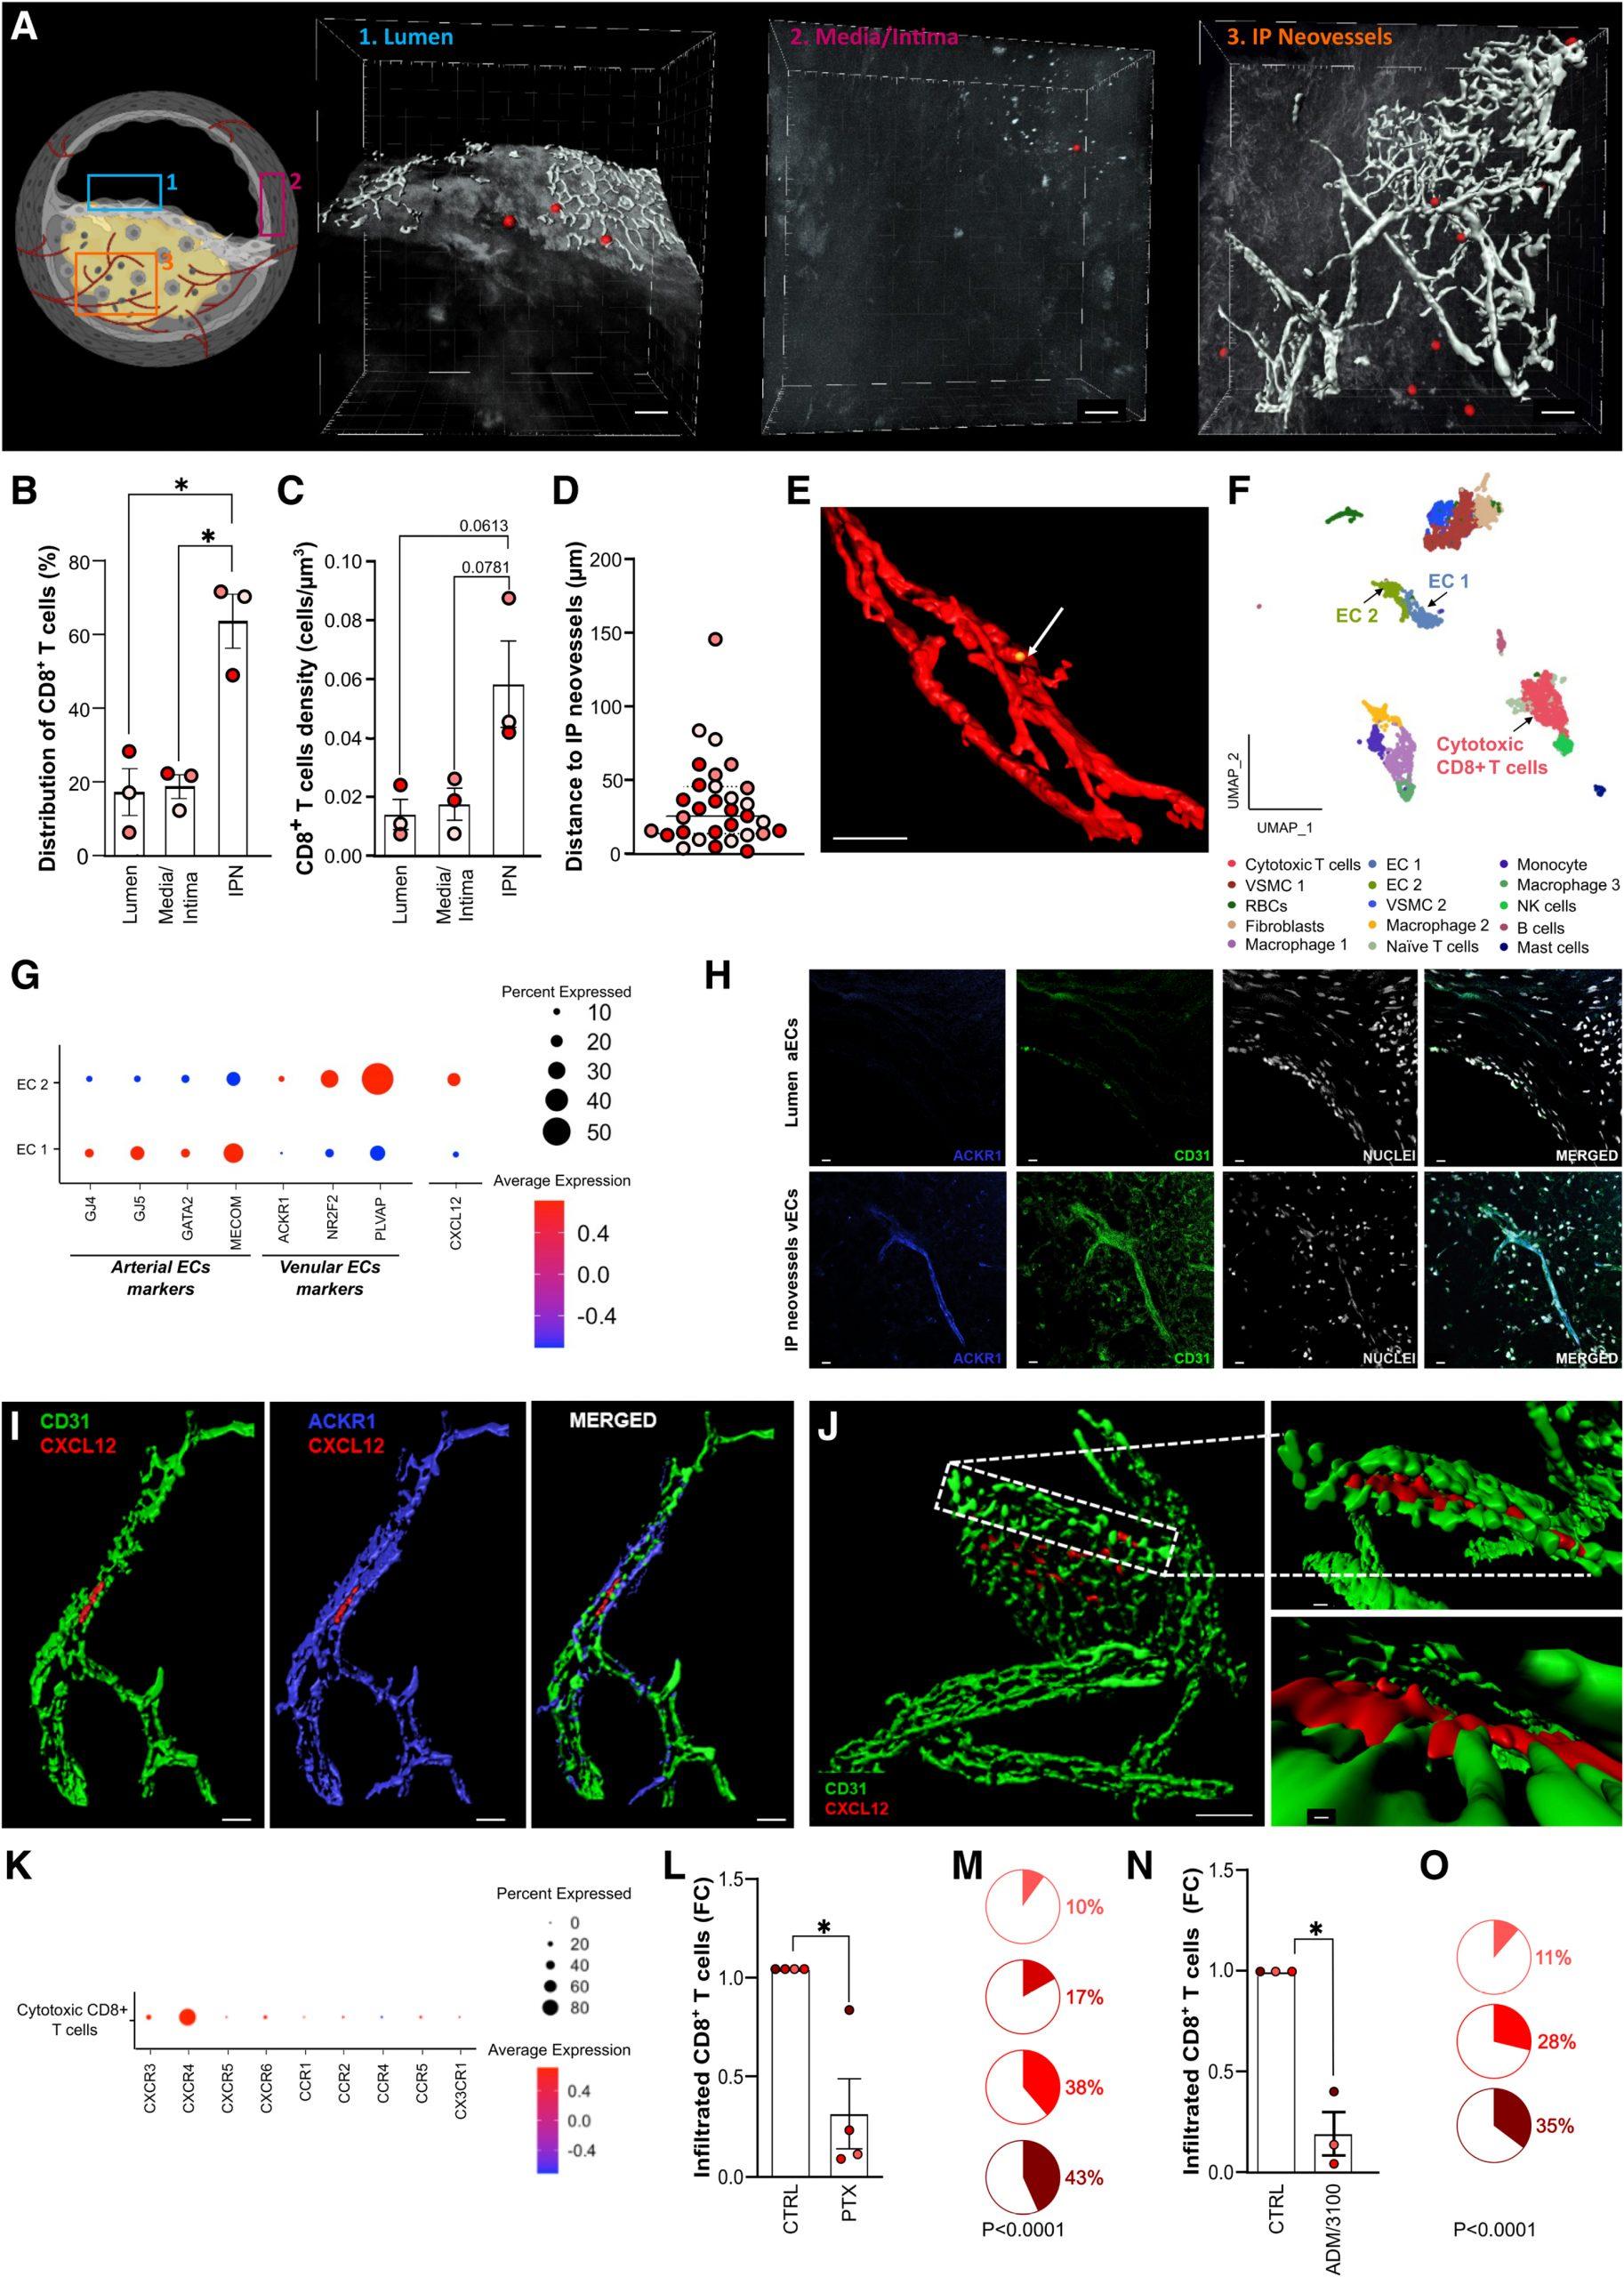
Figure 1: ACKR1+ neovessels in atherosclerotic plaques recruit CD8+ T cells via CXCL12. A through E, Localization of exogenous CD8+ T cells within human atherosclerotic plaques. Human atherosclerotic plaques were placed on a wetted gelatin sponge raft (Spongostan standard, MS002) at the medium–air interface, and double-labeled exogenous CD8+ T cells (CellTracker Deep Red and DNA marker SYTO 41) were added to the culture medium. After 24 hours, the cultured plaque was fixed (2% paraformaldehyde) and immunostained for PECAM-1 (CD31; clone JC70A). Subsequently tissue clearing (Rapiclear 1.55) was performed followed by 3D confocal microscopy analysis (Leica SP8 coupled to a 16X0.6 immersion objective). A, Different regions of the human atherosclerotic plaques were visualized (schematic overview) and representative isosurface renderings (Imaris 8.4) depict the presence of exogenous CD8+ T cells (red dots) in (1) lumen, (2) the border between tunica media and intima, and (3) area rich in IPN. IPNs (grey) and exogenous CD8+ T cells (red) in the microscope datasets were segmented with the Imaris Surface function using the signal derived from CD31 for neovessels and CellTracker Deep Red for CD8+ T cells, the latter of which combined with the DNA marker SYTO 41, which was segmented using the Imaris Spots function. Scale bar, 50 µm. B, Distribution of exogenous CD8+ T cells among the assessed locations expressed as percentage of the total number of cells detected in the plaque. Each color represents a different patient (also in C and D). C, Cell density of exogenous CD8+ T cells in the assessed areas. Absolute number of exogenous CD8+ T cells infiltrating various locations of human atherosclerotic plaques was corrected for the volume recorded for each analyzed area per plaque. D, Distance between exogenous CD8+ T cells and intraplaque neovessels. The distance from each CD8+ T cell to the closest vascular structure was calculated in Imaris (Distance Transform Matlab Xtension) and then subtracted the mean radius for each cell type. E, Representative confocal 3D reconstruction showing an exogenous CD8+ T cell (yellow dot and arrow) located within IP CD31+ neovessels (red). Scale bar, 50 µm. F, UMAP visualization of reclustering of the scRNA-Seq of human atherosclerotic plaques from the Munich Vascular Biobank dataset showing 15 cell populations. Population identities were determined based on marker gene expression. The dataset is available from Gene Expression Omnibus (accession No. GSE247238).3 G, Dot plot visualization showing the expression of arterial marker genes (GJ4, GJ5, GATA2, MECOM), venular marker genes (ACKR1, NR2F2, PLVAP), and CXCL12 in EC1 and EC2, as identified from the scRNA-Seq data (F). H, Immunohistochemistry staining of 5-µm thick sections of a human carotid plaque showing the expression of ACKR1 (clone 2C3; blue) by ECs of IPNs but not by lumen aECs. Nuclei were stained with Hoechst 33342 (grey) and ECs with CD31 (green). Scale bar: 10 µm. I, Isosurface rendering of 3D confocal microscopy data of whole mount, optically cleared human atherosclerotic plaques immunostained with CD31 (NB100-2284; green), ACKR1 (blue) and CXCL12 (clone 79018; red) reveals the presence of CXCL12 in intraplaque ACKR1+ neovessels. Scale bar, 20 µm. J, A close-up 3D isosurface rendering obtained with multiphoton microscopy showing that CXCL12 (red) is detectable on vECs of IPNs (CD31, NB100-2284; green). Scale bar, 30 µm (main rendering) and 10 µm (close-up renderings). K, Dot plot visualization showing the expression of chemokine receptors in cytotoxic CD8+ T cells present in human atherosclerotic plaques from scRNA-Seq (F). Only chemokine receptors with detectable expression values are shown in this plot. L through O, Effect of CXCR4 blockade on CD8+ T cells infiltration in human atherosclerotic plaques. Exogenous CD8+ T cells treated with vehicle control (CTRL), labeled in green with Cell Tracker Green, along with those treated with either PTX (20 nM) or AMD-3100 (1 µM), labeled in red with Cell Tracker DeepRed, were added to the culture medium (described in A through E). After 24 hours, plaques were digested and the presence of exogenous CD8+ T cells was assessed by flow cytometry analysis. L, The number of CTRL- and PTX-treated exogenous CD8+ T cells infiltrated in the plaques was determined. Fractions of the initial input of exogenous T cells was calculated, normalized to the CTRL-treated group for each experiment and presented as fold-change relative to CTRL. Each color-coded dot represents a different patient. M, Distribution of infiltrated CTRL and PTX-treated exogenous CD8+ T cells in the plaques. The percentage of CTRL (white) and PTX-treated (red) exogenous CD8+ T cells was calculated for each patient as the proportion of total cells (CTRL+PTX) that infiltrated the plaques. Each color-coded pie chart represents a different patient. N and O, The same as L and M, but AMD-3100 was used instead of PTX. Values are shown as mean±SEM. Data were tested for normality using the Shapiro–Wilk test. Statistical significance was determined as follows: repeated measures one-way ANOVA test, followed by Dunnett multiple comparison test (B, C); 2-tailed, paired 1-sample t-test (L, N); and binomial test followed by Wilson–Brown method to calculate the confidence interval (M, O). P value <0.05 was deemed as statistically significant. ACKR1 indicates atypical chemokine receptor 1; aEC, arterial endothelial cell; CCR1–5, chemokine receptor 1–5; CD8, 31, cluster of differentiation 8, 31; CTRL, control; CXCR1, 3–6, CXC chemokine receptor types 1, 3–6; CXCL12, CXC motif chemokine ligand 12; EC, endothelial cell; FC, fold-change; GATA2, GATA-binding factor 2; GJ4, Gap junction protein alpha 4; GJ5, Gap junction protein alpha 5; IP, intraplaque; IPN, intraplaque neovessels; MECOM, MDS1 and EVI1 complex locus; NR2F2, nuclear receptor subfamily 2, group F, member 2; NK, natural killer cells; PECAM-1, platelet endothelial cell adhesion molecule 1; PLVAP, plasmalemma vesicle–associated protein; PTX, pertussis toxin; RBCs, red blood cells; scRNA-Seq, single-cell RNA sequencing; UMAP, Uniform Manifold Approximation and Projection for Dimension Reduction; vEC, venular endothelial cell; and VSMC, vascular smooth muscle cell.
Key Discovery
- CD8⁺ T cells are the most abundant hematopoietic immune cells in human atherosclerotic plaques.
- Using a 3D ex vivo tissue culture model, the team showed that CD8⁺ T cells preferentially localise near neovessels (newly formed blood vessels) within plaques.
- Endothelial cells of these vessels produce high levels of the chemokine CXCL12.
- Blocking the receptor CXCR4 on CD8⁺ T cells significantly reduced their migration into plaques.
Mechanistic Insights
- Plaque neovascularization → Endothelial cells upregulate CXCL12
- CXCL12 gradient attracts circulating CD8⁺ T cells
- CXCR4-dependent migration drives T cell accumulation in plaques
- Blocking CXCR4 → Reduces CD8⁺ infiltration, suggesting pathway is druggable
Significance
- First direct evidence that CXCL12–CXCR4 signaling mediates CD8⁺ T cell recruitment in human atherosclerotic plaques.
- Identifies a novel therapeutic axis:
- CXCL12–CXCR4 blockade may limit pro-inflammatory immune infiltration in cardiovascular disease.
- Offers opportunities for immune-targeted therapies in atherosclerosis, complementing lipid-lowering strategies.
This study reveals that the CXCL12-CXCR4 pathway orchestrates CD8⁺ T cell entry into plaques, opening new possibilities for treating atherosclerosis by modulating immune cell trafficking.
Journal article: Parma, L., et al., 2025. CXCL12 Derived From ACKR1 + Intraplaque Neovessels Mediates CD8 T Cell Recruitment in Human Atherosclerosis. Circulation.
Summary by Stefan Botha