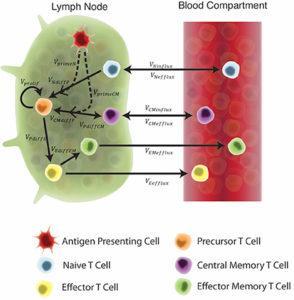
Schematic of the two-compartment model. Each equation represents a concentration of a particular cell type, as outlined in the legend. These concentrations are dependent on other cell concentrations and interactions (as shown by arrows) between cells or compartments. Arrow labels are defined in greater detail in Supplementary Materials 1. Briefly, VprimeN and VprimeCM represents the impact of APCs on naïve and central memory cell recruitment. VNdiffP and VCMdiffP shows the transformation of naïve and central memory T cells to the precursor T cell population. Vprolif, VPdiffE, VPdiffCM, and VEdiffEM represents precursor proliferation and differentiation to effector, central memory and effector memory cell types, respectively. Finally, influx and efflux rates between LN and blood are shown as VNinflux, VCMinflux, VCMefflux, VEefflux, and VEMefflux. (Source Joslyn et al., 2018: Figure 2)
Testing of Tuberculosis (TB) candidate vaccines in animal models such as non-human primates (NHPs) is crucial for the design and development of clinical TB vaccine trials. However, translating outcomes from NHP models to human application is challenging. Researchers whom tested the H56 candidate vaccine in NHPs and humans used mathematical modeling to compare vaccine induced immunity between these two species. H56 is a TB candidate vaccine that contains Mycobacterium tuberculosis (M.tb) antigens: Ag85B, ESAT-6 and RV2660c adjuvanted with either IC31 (tested humans and NHPs) or CAF01 (tested in NHPs).
In the NHP model, vaccine induced ESAT-6-specific responses were predominantly effector cells at early timepoints, which shifted to predominantly central memory responses at later timepoints. Where as ESAT-6-specific responses induced in humans were predominantly effectors at all timepoints. Researchers developed a mathematical model that recapitulates variability of immune responses in NHPs and humans, and described T cell priming, proliferation and differentiation of T cells following H56 vaccination. Results of these models showed that ESAT-6-specific responses are similarly skewed to an effector memory phenotype in NHPs and humans. However, proliferation and differentiation of antigen-specific cells is superior in NHPs compared with humans. This difference could be due to increased exposure and diversity of environmental factors in humans compared with NHPs.
H56 contains Ag85B, an antigen present in both M.tb and BCG. Since Bacillus Calmette–Guérin vaccine is given at birth or during infancy, the H56 NHP preclinical study BCG vaccinated macaques prior to receiving H56. This enabled Joslyn et al., to determine the impact of BCG priming and differences in BCG vaccination timing on H56 immune responses in both species using a mathematical model. Based on their results, they concluded that “BCG similarly influences H56 immunogenicity in both NHPs and humans by upregulating differentiation to the central memory phenotype in the Ag85B-specific CD4+ T cell response.”
In summary, Joslyn et al., used mathematical modelling to gain a better understanding of H56 vaccine response in NHPs and humans. Overall immune responses observed In NHPs and humans are similar. This study also shows the utility of mathematical modelling in the evaluation of vaccination strategies.
Journal Article: Joslyn et al., 2018. Integrating Non-human Primate, Human, and Mathematical Studies to Determine the Influence of BCG Timing on H56 Vaccine Outcomes. Frontiers in Microbiology
Article by Cheleka AM Mpande


